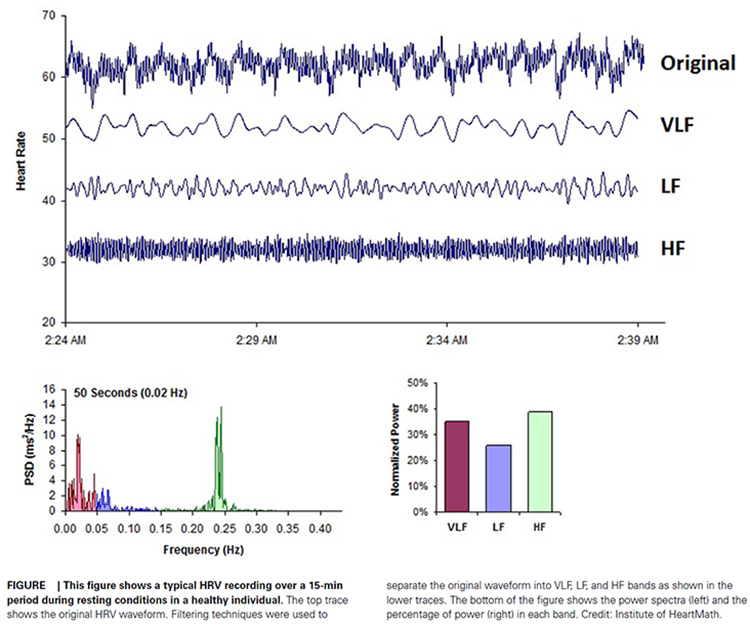
Heart Rate Variability Meaning and Measurements (1 Hour)
"HRV is the organized fluctuation of time intervals between successive heartbeats defined as interbeat intervals" (Shaffer, Meehan, & Zerr, 2020).
The oscillations of a healthy heart are complex. HRV indexes how efficiently we mobilize and utilize limited self-regulatory resources to maintain homeostasis. HRV plays a vital role in regulatory capacity, executive functions, health, and performance. A healthy heart can rapidly adjust to sudden challenges due to the cooperation of interlocking and better-calibrated control systems. HRV is crucial to health, performance, and resilience. Behavioral interventions like aerobic exercise, healthy breathing, compassion, and mindfulness meditation are powerful strategies for increasing HRV. Graphic © Maridav/Shutterstock.com
BCIA Blueprint Coverage
This unit addresses Heart Rate Variability Meaning and Measurements (2 hours) and covers HRV, Time-Domain Measurements, Frequency-Domain Measurements, and Assessment.

This section covers The Meaning of HRV, The Sources of HRV, Factors that Influence HRV, Correlates of Low and Normal HRV, The Benefits of HRV, and Heart-Brain Interactions.
A. The Meaning of HRV
Heart rate is the number of heartbeats per minute. Graphic © Crdjan/Shutterstock.com.

Elevated HR Is Associated with Dementia and Cognitive Decline
Imahori et al. (2021) conducted a cohort study of 2147 adults ≥ 60 who were free of dementia when they entered the study. Resting heart rates (RHR) ≥80 (compared with 60-69 bpm) were associated with a greater risk of dementia and more rapid cognitive decline, independent of cardiovascular disease (CV).Elevated HR Limits HRV
HR is important because a high rate can reduce heart rate variability (HRV), the changes in the time intervals between consecutive heartbeats (Task Force of the European Society of Cardiology and the North American Society of Pacing and Electrophysiology, 1996). Graphic © arka38/Shutterstock.com.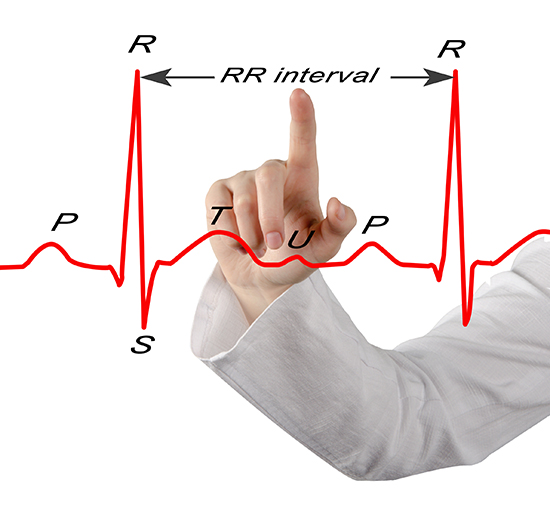
Listen to a mini-lecture on a Heart Rate Variability Overview © BioSource Software LLC.
We measure the time intervals between successive heartbeats in milliseconds. Graphic courtesy of Dick Gevirtz.
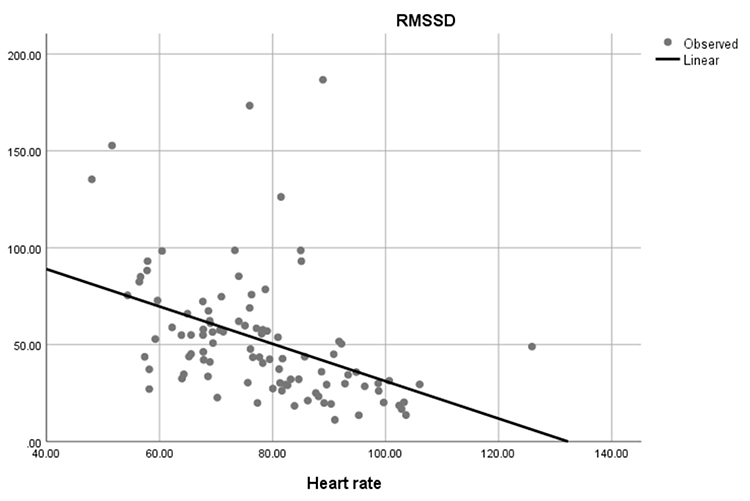
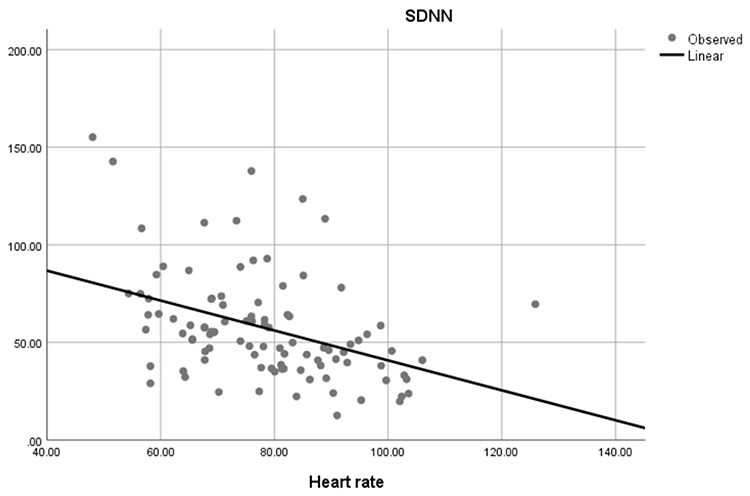
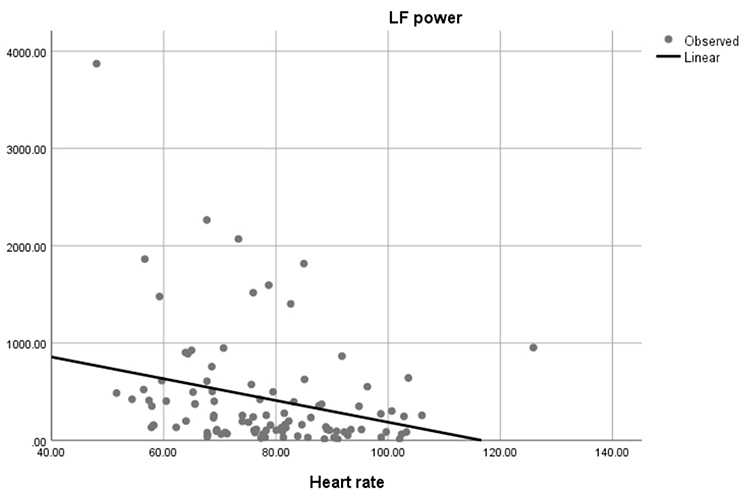
Faster HRs reduce the time between successive beats and the opportunity for interbeat intervals (IBIs) to vary. Faster HRs lower HRV. Resting HRs that exceed 90 bpm are associated with an elevated risk of mortality (Zhang, Shen, & Qi, 2016). The next three scatterplots show an inverse relationship between HR and three widely used HRV metrics: RMSSD, SDNN, and low-frequency power.
Conversely, the slower HRs seen in endurance sports like trail running increase the time between adjacent heartbeats and the chance for IBIs to vary. This raises HRV. This phenomenon is called cycle length dependence (McCraty & Shaffer, 2015). Graphic © Maridav/Shutterstock.com.

Typical non-athlete HRs are 60-80 bpm. Athletes may have HRs between 40-60 bpm (Khazan, 2019). Graphic © Jacob Lund/Shutterstock.com.

Dr. Gevirtz explains HRV © Association for Applied Psychophysiology and Biofeedback. You can enlarge this video by clicking on the bracket icon at the bottom right of the screen. When finished, click on the ESC key.
A Healthy Heart Is Not a Metronome
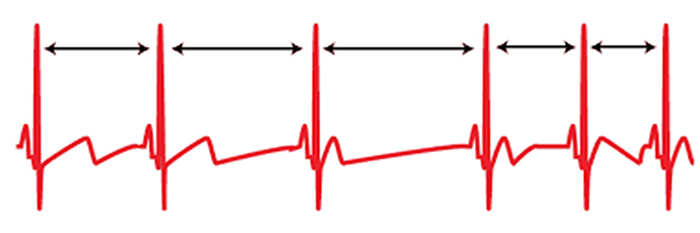
A healthy heart is not a metronome.
When the time intervals between heartbeats significantly change across successive breathing cycles, this shows that the cardiovascular center can effectively modulate vagal tone.
Listen to a mini-lecture on Why Is Heart Rate Variability Important? © BioSource Software LLC.
The record below shows healthy variability. The time intervals between successive heartbeats differ.
In contrast, this record shows no variability since the IBIs are identical. This display could represent a heart driven by a pacemaker or a heart that needs one.
"The complexity of a healthy heart rhythm is critical to the maintenance of homeostasis because it provides the flexibility to cope with an uncertain and changing environment...HRV metrics are important because they are associated with regulatory capacity, health, and performance and can predict morbidity and mortality" (Shaffer, Meehan, & Zerr, 2020).
Check out the YouTube video HRV Training and its Importance. Graphic © Axynia/Shutterstock.com."... HRV is associated with executive function, regulatory capacity, and health... Cardiac vagal control indexes how efficiently we mobilize and utilize limited self-regulatory resources during resting, reactivity, and recovery conditions" (Shaffer, Meehan, & Zerr, 2020).
The modulation of vagal tone helps maintain the dynamic autonomic balance critical to cardiovascular health. Autonomic imbalance due to deficient vagal inhibition is implicated in increased morbidity and all-cause mortality (Thayer, Yamamoto, & Brosschot, 2010).HRV appears to index autonomic functioning, BP, neurocardiac functioning, digestion, oxygen and carbon dioxide exchange, vascular tone (diameter of resistance vessels), and possibly facial muscle regulation (Gevirtz et al., 2016). HRV reflects the vagal contribution to executive functions, affective control, and social self-regulation (Byrd et al., 2015; Laborde et al., 2017; Mather & Thayer, 2018).
Vagal tank theory (Laborde et al., 2018) argues that vagal traffic to the heart indicates how efficiently we mobilize and use scarce self-regulatory resources.
The Sources of HRV
HRV is produced by interacting regulatory mechanisms that operate on different time scales (Moss, 2004). Circadian rhythms, core body temperature, and metabolism contribute to 24-hour HRV recordings, representing the "gold standard" for clinical HRV assessment. The parasympathetic, cardiovascular, and respiratory systems produce short-term (e.g., 5-minute) HRV measurements.
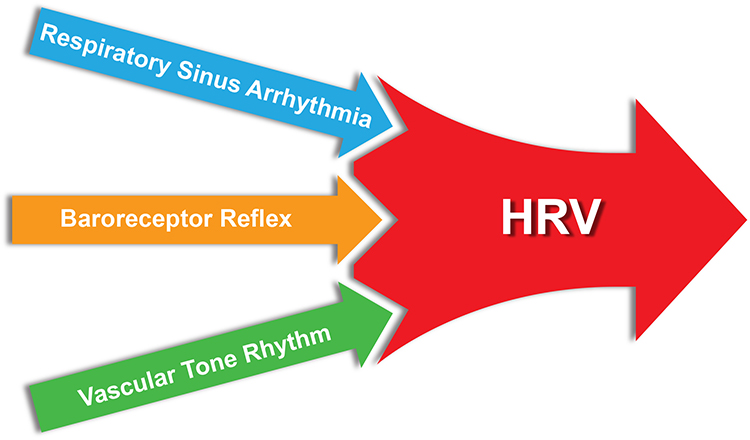
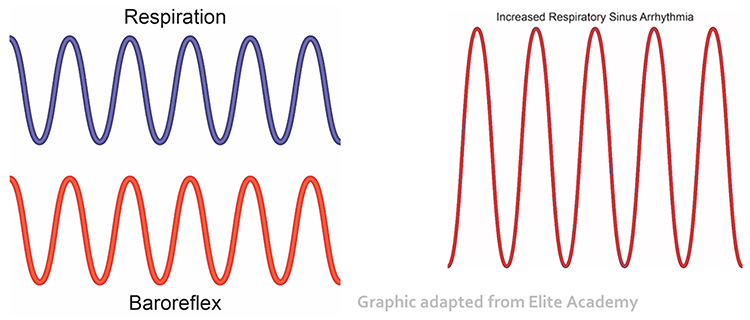
Respiratory sinus arrhythmia, the baroreceptor reflex, and the vascular tone rhythm are the most important sources of HRV (Hayano & Yuda, 2019; Vaschillo et al., 2002).
Listen to a mini-lecture on Sources of Heart Rate Variability © BioSource Software LLC.
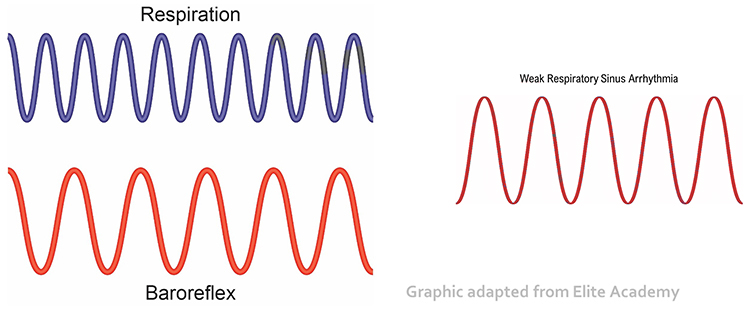
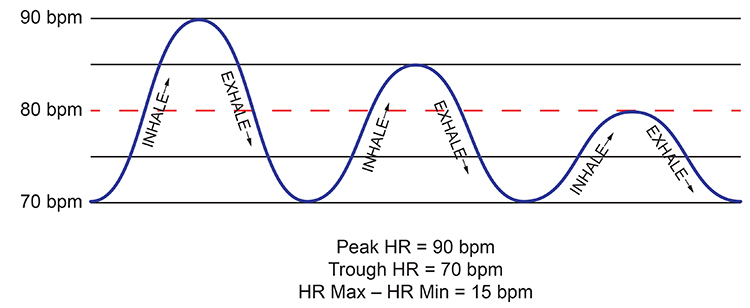
Respiratory sinus arrhythmia (RSA), HR speeding and slowing across each breathing cycle, is the primary and entirely parasympathetic source of HRV (Gevirtz, 2020). Graphic adapted from Elite Academy.
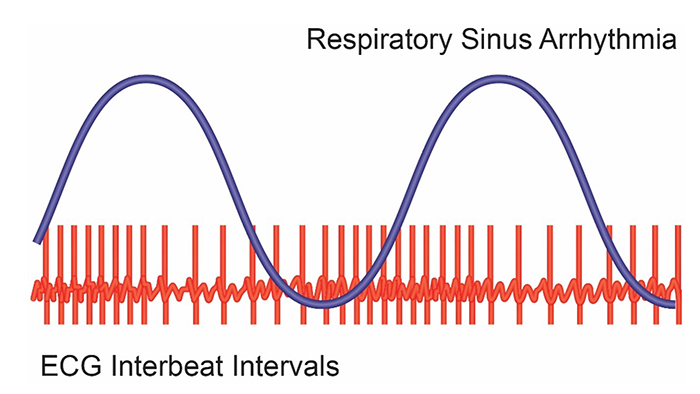
Inhalation partially disengages the vagal brake, speeding HR. This is purely parasympathetic. Graphics inspired by Dick Gevirtz.
Exhalation reapplies the vagal brake, slowing HR.
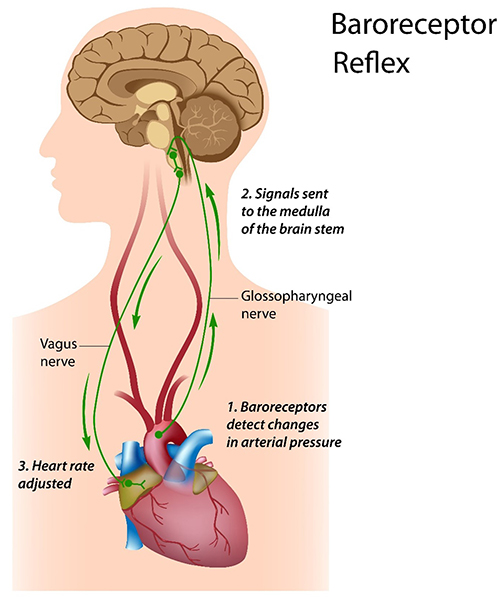
The baroreceptor reflex, which exerts homeostatic control over acute BP changes, is the second most important and entirely parasympathetic source of HRV (Gevirtz, 2020).
Listen to a mini-lecture on the Baroreceptor Reflex © BioSource Software LLC. Graphic © Alila Sai Mai/Shutterstock.com.
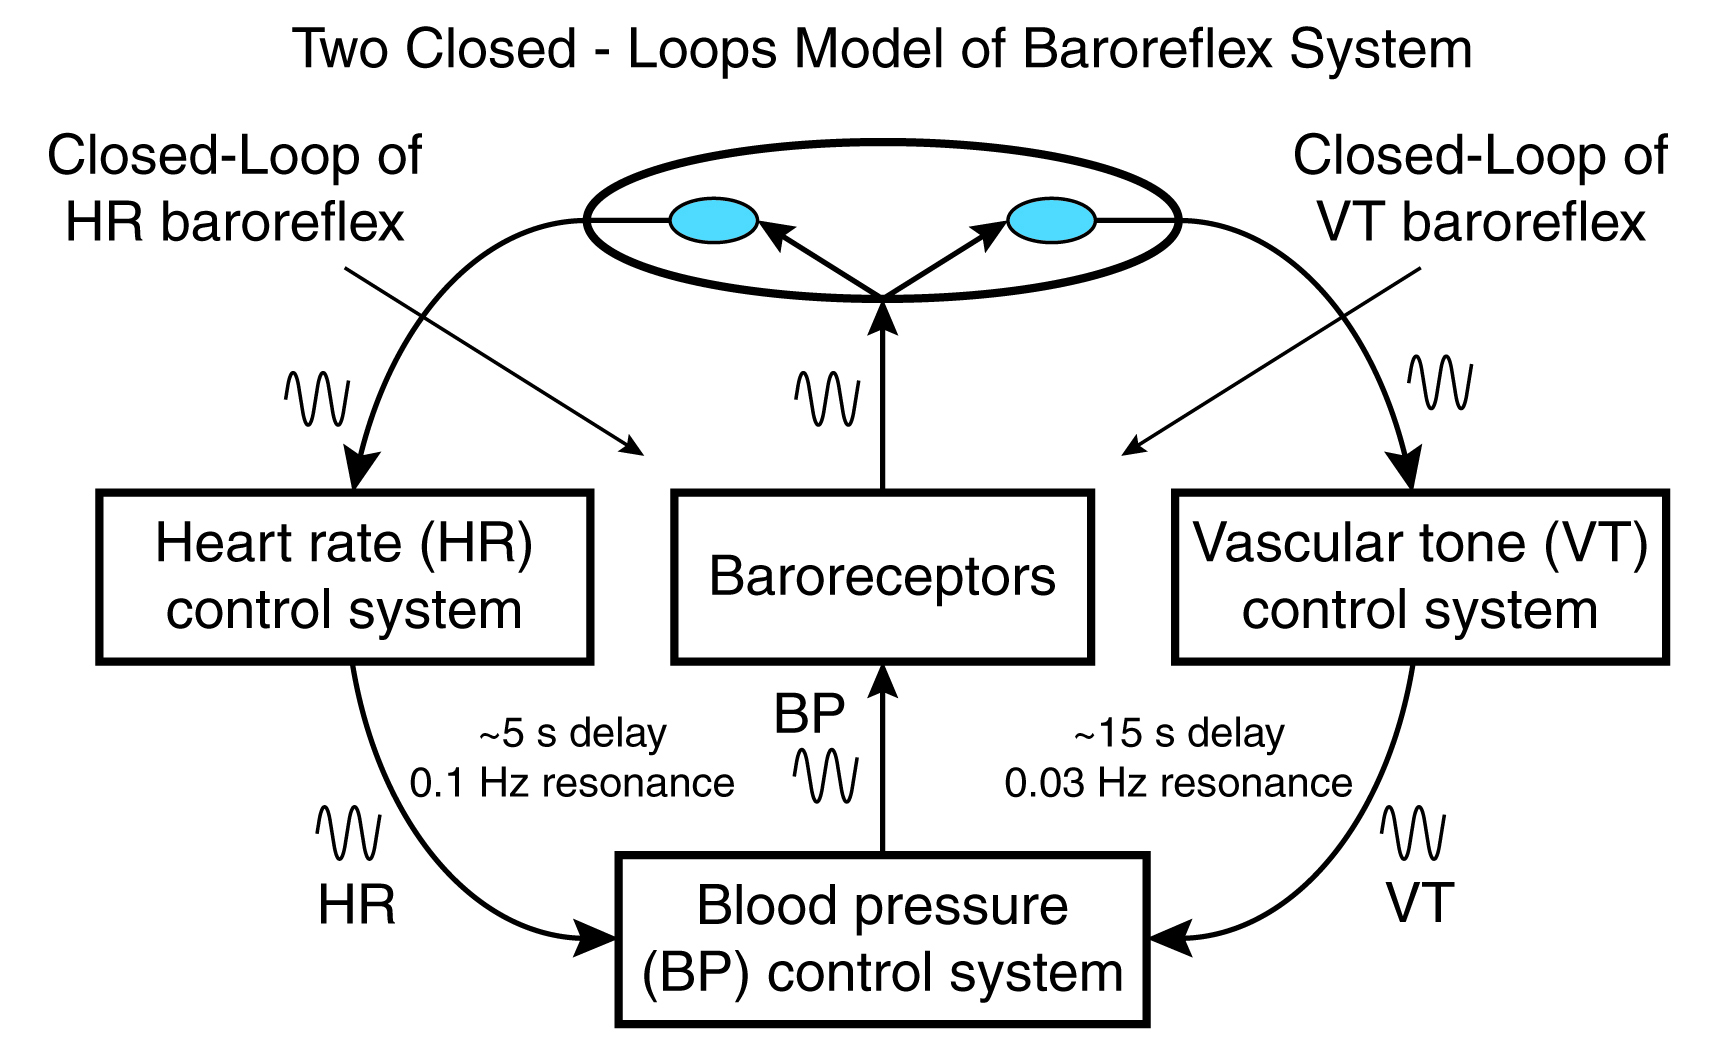
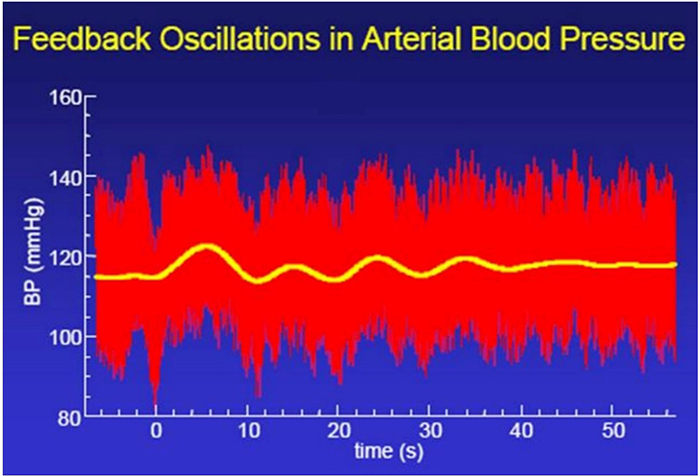
The vascular tone (VT) control system with a 15-second delay and 0.03 Hz resonance is the third source of HRV. Vaschillo and colleagues (2002) proposed that there is a VT baroreflex closed-loop that works in concert with HR baroreflex closed-loop to regulate blood pressure (BP) and heart rate (HR). Graphic adapted from Vaschillo.
Factors That Influence HRV
Critical factors that influence HRV include HR, resonance, respiration rate, and depth.
HR Limits HRV
We discussed cycle length dependence earlier. Faster HRs decrease the opportunity for IBIs to vary in length, whereas slower HRs increase the chance of beat-to-beat differences.Resonance
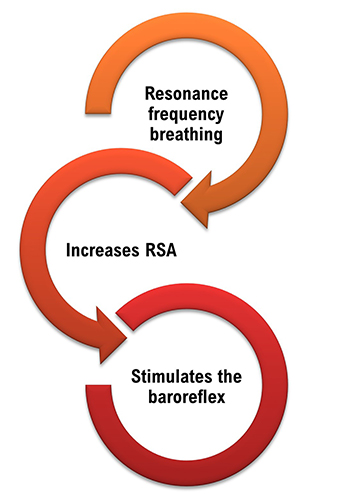
Slow-paced breathing increases RSA by stimulating the baroreceptor system at its unique resonance frequency (RF; ~ 0.1 Hz). The RF is caused by the delay in the baroreflex (Lehrer et al., 2004). Before HRVB, respiration and the baroreflex are usually out of phase resulting in weak resonance effects.
Visualize pushing a child on a swing. There is a single frequency that moves the child the highest. The best pushing rate is analogous to the RF (Khazan, 2020). Graphic © Billion Photos/Shutterstock.com.

Resonance is simple physics (Lehrer, 2020). A bell struck by a Buddhist monk for prayer time resonates after the initial strike. Graphic © Amith Nag/Shutterstock.com.

Dr. Lehrer explains resonance © Association for Applied Psychophysiology and Biofeedback.
The baroreflex system exhibits resonance since it is a feedback system with a fixed delay. Inertia due to blood volume in the vascular tree accounts for most of this delay.
Listen to a mini-lecture on Resonance © BioSource Software LLC. Graphic © Shot4Sell/Shutterstock.com.
Taller people and men have lower resonance frequencies than women and shorter people because they have larger blood volumes.

When clients breathe at their RF, HR and respiration are in perfect phase (0°); their peaks and valleys coincide.
Listen to a mini-lecture on the RF © BioSource Software LLC.
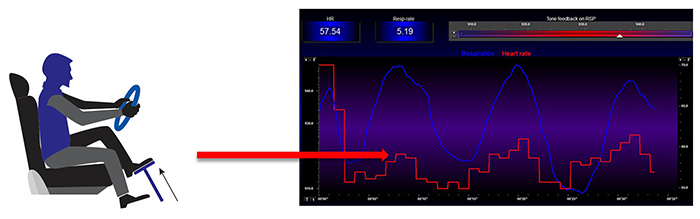
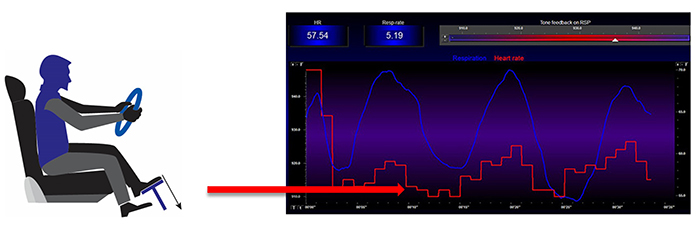
Resonance frequency breathing also modulates BP changes since HR and BP oscillations are 180° out of phase (DeBoer, Karemaker, & Strackee, 1987; Vaschillo et al., 2002). Graphic adapted from Evgeny Vaschillo.
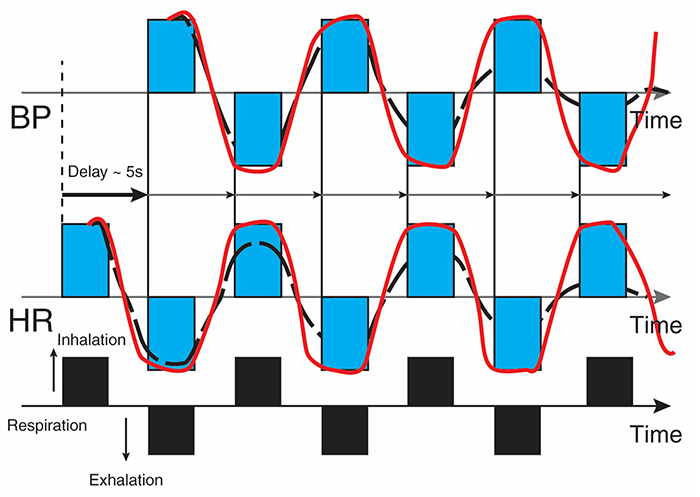
Revised caption: The bottom line represents respiration. A rising black bar is inhalation, and a falling black bar means exhalation. The following lines represent HR and BP. This diagram allows us to see the changes in HR and BP produced by breathing. Starting at the bottom left, inhalation speeds the heart, and about 5 seconds later, BP falls. During exhalation, the heart slows, and about 5 seconds later, BP increases.
Before HRVB, respiration and the baroreflex are usually out of phase resulting in weak resonance effects. Graphic adapted from Elite Academy.
Listen to a mini-lecture on RF Breathing © BioSource Software LLC.
HRV biofeedback training slows breathing to the baroreflex’s rhythm, which aligns these processes and significantly increases resonance effects. Graphic adapted from Elite Academy.
Slowing breathing to rates between 4.5-6.5 bpm for adults and 6.5-9.5 bpm for children increases RSA (Lehrer & Gevirtz, 2014). Increased RSA immediately “exercises” the baroreflex without changing vagal tone or tightening BP regulation. Those changes require weeks of practice. HRV biofeedback can increase RSA 4-10 times compared to a resting baseline (Lehrer et al., 2020b; Vaschillo et al., 2002).
Listen to a mini-lecture on Increased RSA © BioSource Software LLC. Graphic adapted from Gevirtz et al., 2016.
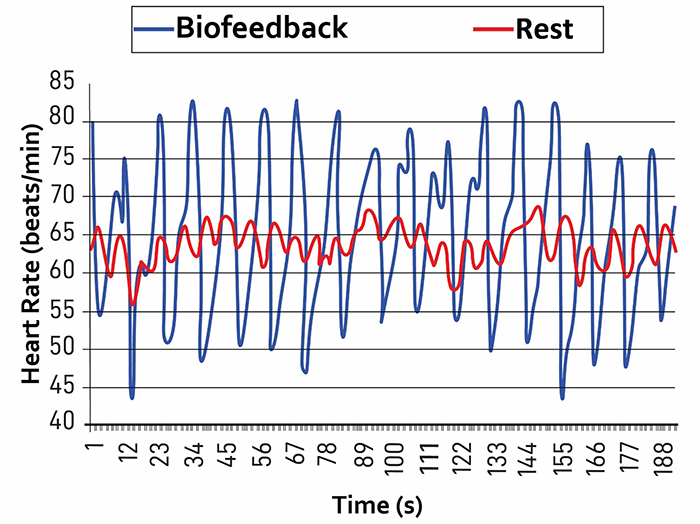
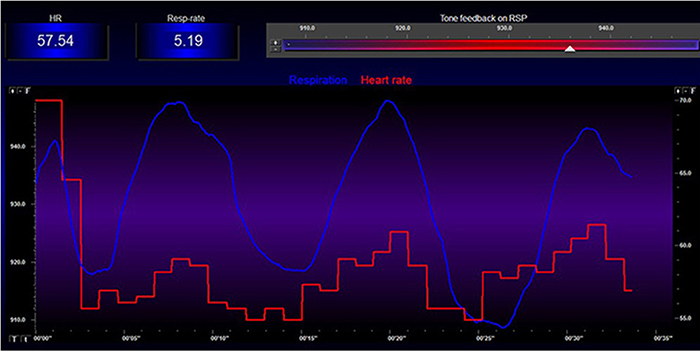
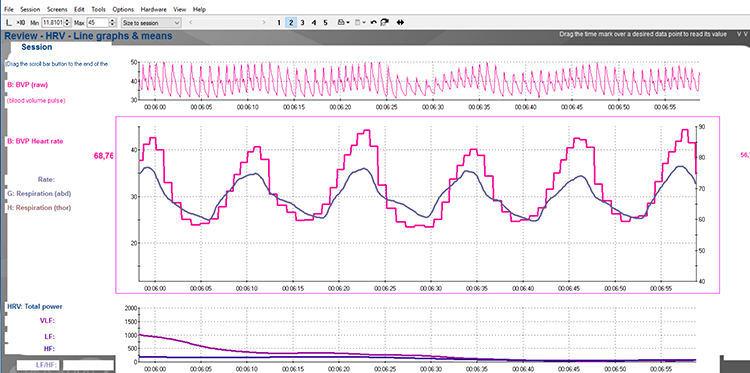
Caption: The red waveform shows HR oscillations while resting without breathing instructions or feedback. The blue waveform shows HR oscillations with HRV biofeedback and breathing from 4.5-6.5 bpm.
Listen to a mini-lecture on HRV Changes During and After Training © BioSource Software LLC.
You can observe the effect of a breathing rate on RSA during paced breathing and select the rate that produces the largest HR oscillations. Adult breathing from 4.5-6.5 bpm shifts the ECG peak frequency from the high-frequency band (~0.20 Hz) to the cardiovascular system’s RF (~0.10 Hz). This more than doubles the energy in the low-frequency band of the ECG (0.04-0.15 Hz).
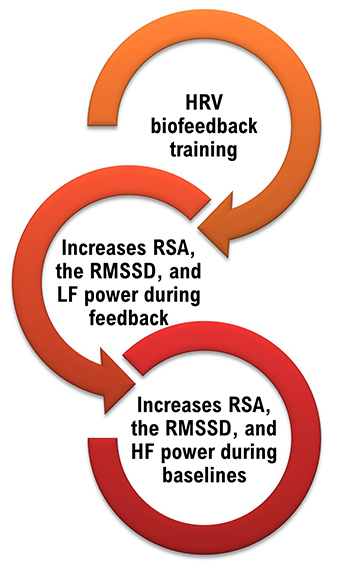
We train clients to increase low-frequency power and RSA so that high-frequency power and time-domain measures like the RMSSD will increase during baselines when breathing at typical rates (Lehrer, 2020).
Breathing Rate and Depth
RSA increases with greater respiratory depth (Hirsch & Bishop, 1981) and lowers respiration rate (Brown et al., 1993). The graphic below was adapted from Grossman and Kollai (1993). RSA, shown as a change in heart rate from inhalation to exhalation, increases as the respiration rate approaches 6 bpm.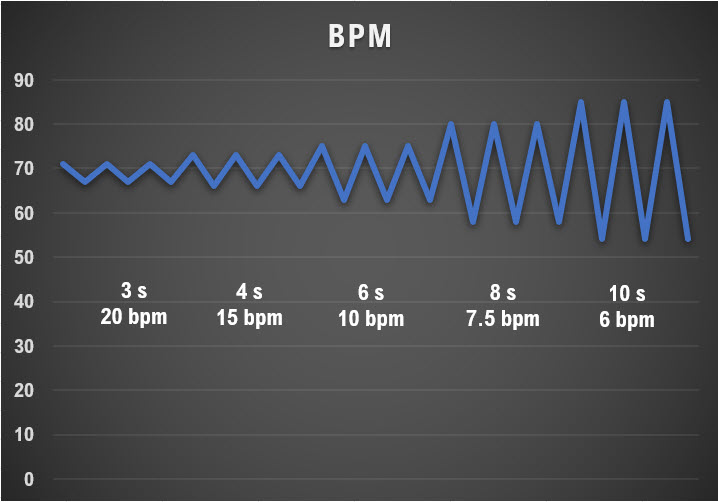
Correlates of Low and Normal HRV
Heart Rate Variability Is a Marker for Disease and Adaptability
Since a healthy cardiovascular system integrates multiple control systems, its overlapping oscillatory patterns are chaotic.Listen to a mini-lecture on Heart Rate Variability Is a Marker for Disease and Adaptability © BioSource Software LLC.
The double compound pendulum animation from Wikipedia shown below illustrates chaotic behavior. Slightly changing the pendulum's starting condition results in a radically different trajectory.

A healthy heart exhibits complexity in its oscillations and rapidly adjusts to sudden physical and psychological challenges due to its effective interlocking cardiac control systems. A healthy heart illustrates the concept of allostasis or the achievement of stability through change. In contrast, an aging or diseased heart shows noncomplex oscillations and ineffectively responds to sudden demands due to the breakdown of its control mechanisms (Lehrer & Eddie, 2013). Check out the YouTube video Heart Rate Variability (HRV) Biofeedback by Mark Stern.
Heart rate variability biofeedback is extensively used to treat various disorders (e.g., asthma and depression) and enhance performance in various contexts (e.g., sports; Gevirtz, 2013; Lehrer et al., 2020a; Tan et al., 2016).
Lehrer et al. (2020) observed that “…HRVB has the largest effect sizes on anxiety, depression, anger, and athletic/artistic performance and the smallest effect sizes on PTSD, sleep, and quality of life” (p. 109).
Although the final targets of these applications may differ, HRVB increases vagal tone (Vaschillo et al., 2006) and stimulates the negative feedback loops responsible for homeostasis (Lehrer & Eddy, 2013).
Whereas HRV is desirable, BP variability can endanger health. We require BP stability under constant workloads (Gevirtz, 2020). Graphic courtesy of Dick Gevirtz.
Reduced HRV Is Associated with Disease and Loss of Adaptability
In the early 1960s, researchers found that changes in HRV preceded fetal distress (Hon & Lee, 1963).Listen to a mini-lecture on Reduced HRV Is Associated with Disease and Loss of Adaptability © BioSource Software LLC. Graphic © SciePro/Shutterstock.com.

Reduced HRV is associated with vulnerability to physical and psychological stressors and disease (Lehrer, 2007).
Graphic © Arseniy Krasnevsky/Shutterstock.com.

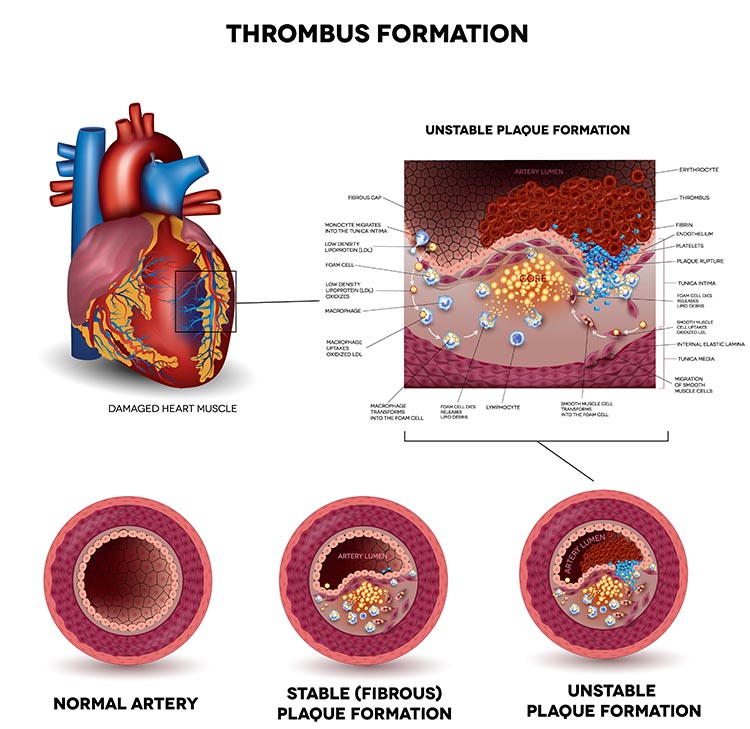
Prospective studies have shown that decreased HRV is the strongest independent predictor for the progression of coronary atherosclerosis (McCraty & Shaffer, 2015). Graphic © Tefi/Shutterstock.com.
Low HRV is a marker for cardiovascular disorders, including hypertension, especially with left ventricular hypertrophy; ventricular arrhythmia; chronic heart failure; and ischemic heart disease (Bigger et al., 1995; Casolo et al., 1989; Maver, Strucl, & Accetto, 2004; Nolan et al., 1992; Roach et al., 2004). Low HRV predicts sudden cardiac death, particularly due to arrhythmia following myocardial infarction and post-heart attack survival (Bigger et al., 1993; Bigger et al., 1992; Kleiger et al., 1987).
Depression in myocardial infarction (MI) patients increases mortality. Depressed patients are twice as likely as non-depressed individuals to have lower HRV (16% vs. 7%). Lower HRV is a strong independent predictor of post-MI death (Craney et al., 2001). HRVB might reduce anxiety and depression, which are associated with low vagal activity because it increases vagal tone. From Friedman’s (2007) perspective, the problem is not “a sticky accelerator.” HRVB may fix “bad brakes” (p. 186).
Reduced HRV may predict disease and mortality because it indexes reduced regulatory capacity, which is the ability to surmount challenges like exercise and stressors. Patient age may be an essential link between reduced HRV and regulatory capacity since both HRV and nervous system function decline with age (Shaffer, McCraty, & Zerr, 2014). Graphic © Maridav/Shutterstock.com.

Reduced HRV is also seen in disorders with autonomic dysregulation, including anxiety and depressive disorders, and asthma, and vulnerability to sudden infant death (Agelink et al., 2002; Carney et al., 2001; Cohen & Benjamin, 2006; Giardino, Chan, & Borson, 2004; Kazuma, Otsuka, Matsuoka, & Murata, 1997). Lehrer (2007) believes that HRV indexes adaptability and marshals evidence that increased RSA represents more efficient regulation of BP, HR, and gas exchange by synergistic control systems.
Dr. Lehrer explains how disease affects the normally chaotic ECG signal © Association for Applied Psychophysiology and Biofeedback.
The Benefits of Increased HRV
The core benefits of increased HRV are enhanced RSA, low-frequency band power, carbon dioxide and oxygen regulation, baroreflex gain and blood pressure (BP) regulation, modulation of immunity, and remodeling damaged hearts.
RSA
When clients breathe at their resonance frequency, HR and respiration are in perfect phase (0o); their peaks and valleys coincide. In adults, this frequency varies from 4.5-6.5 breaths per minute (Gevirtz, Lehrer, & Schwartz, 2016). When clients breathe at this rate, they “exercise” the baroreflex.Resonance frequency (RF) breathing amplifies the swings in HR produced by the baroreflex, increasing baroreflex gain and RSA. RF breathing also modulates blood pressure changes since HR and BP oscillations are 180o out of phase (DeBoer, Karemaker, & Strackee, 1987; Vaschillo et al., 2002).
Low-frequency Band Power
RF breathing shifts the peak frequency from the high-frequency band (~0.20 Hz) to the cardiovascular system’s RF (~0.10 Hz). RF breathing more than doubles the energy in the low-frequency band of the ECG (0.04-0.15 Hz). This corresponds to the Institute of HeartMath's concept of coherence, in which a client produces a "narrow, high-amplitude, easily visualized peak" from 0.09-0.14 Hz (Ginsberg, Berry, & Powell, 2010, p. 54; McCraty et al., 2009).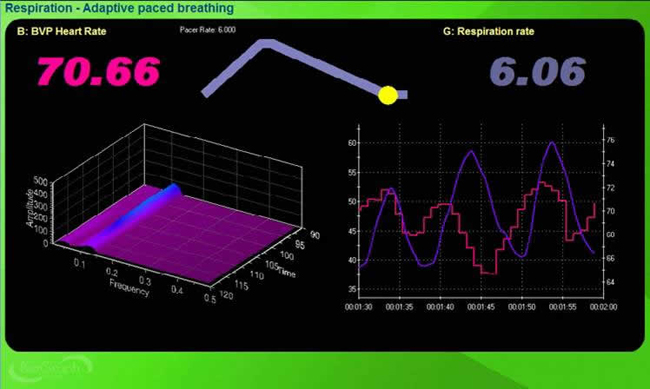
Regulation of Carbon Dioxide and Oxygen
The perfect phase relationship between HR and respiration rate results in the most efficient gas exchange and optimal oxygen saturation (Bernardi et al., 2001; Vaschillo, Vaschillo, & Lehrer, 2004; Yasuma & Hayano, 2004). Graphic © Designua/Shutterstock.com.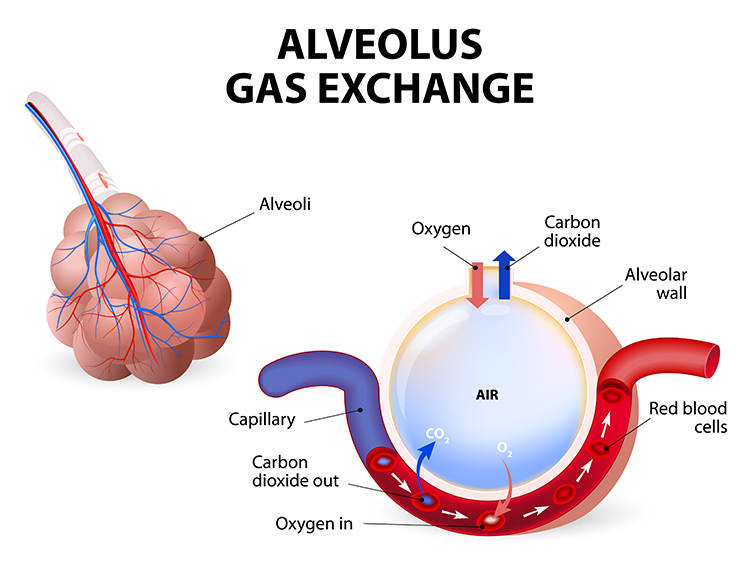
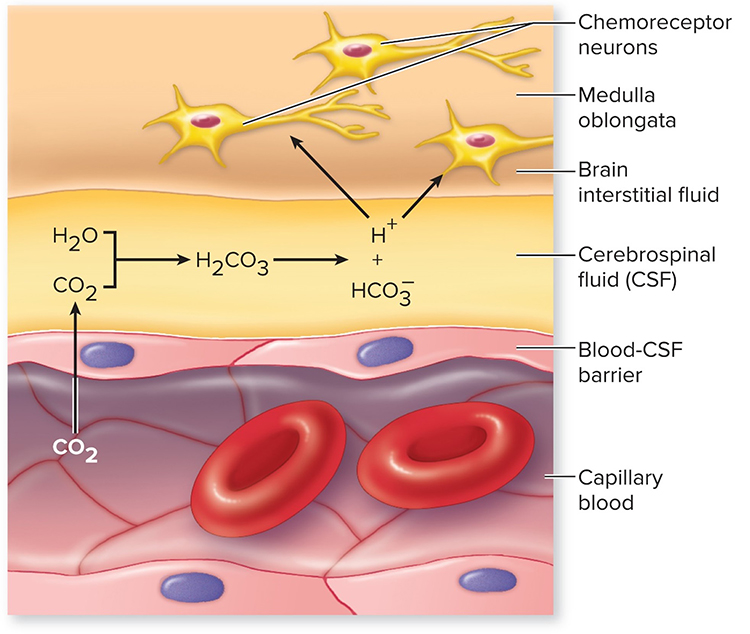
Resonance frequency training also improves oxygen regulation by increasing the sensitivity of chemoreceptors that detect oxygen and carbon dioxide. Graphic © McGraw-Hill.
Baroreflex Gain and BP Regulation
While HRV biofeedback training immediately produces large-scale RSA increases, months of practice can increase baroreflex gain when clients are not receiving feedback (Lehrer, 2013; Lehrer et al., 2003). Increased baroreceptor gain is analogous to a more sensitive thermostat. The body regulates BP more effectively. Graphic © Sean Locke Photography/Shutterstock.com.
Increased baroreflex gain means that the cardiovascular system produces large-scale HR increases and decreases when a client inhales and exhales. This, in turn, translates into greater HRV.
Modulation of Immunity
Like vagal nerve stimulation (VNS), resonance frequency breathing may also influence the parasympathetic cholinergic cytokine control system that modulates immunity through interleukins and interferons (Gevirtz, 2013; Tracey, 2007).The sensory vagus detects inflammation/infection via tissue necrosis factor (TNF) and interleukin-1 (IL-1). The motor vagus signals descending neurons to release norepinephrine to spleen T cells, prompting these cells to release acetylcholine to macrophages to dampen inflammation (Schwartz, 2015).
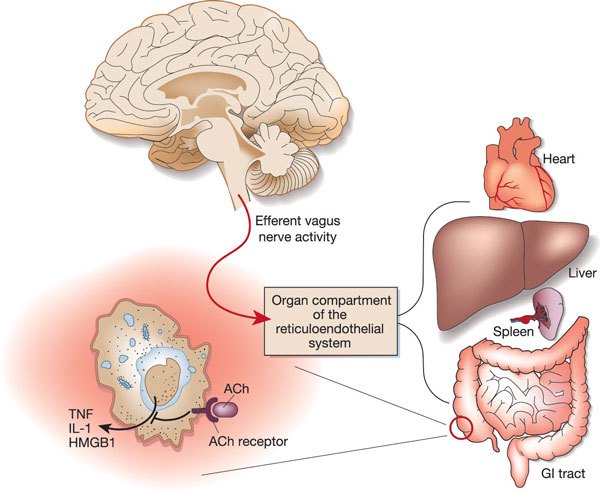
Chronic inflammation is implicated in various disorders, including Alzheimer's, cancer, cardiovascular diseases, depression, and diabetes (Dhar, Lambert, & Barton, 2016; Poole, Dickens, & Steptoe, 2011). Graphic © arka38/Shutterstock.com.

Lehrer et al. (2010) demonstrated that subjects trained to breathe at their RF minimized the reduction of HRV, headache, and eye photosensitivity following an injection of lipopolysaccharide (LPS), an inflammatory cytokine.
Remodeling Failing Hearts
Moravec and McKee (2013) reported preliminary evidence that HRV biofeedback may act like a left ventricular assist device (LVAD) to help remodel failing hearts.Examination of harvested hearts revealed that transplant candidates trained to slow their breathing down to 8-9 breaths per minute increased the numbers of β1 receptors on cardiac muscle fibers and cardiac muscle contraction in response to norepinephrine (NE) and epinephrine (E). Graphic © Africa Studio/ Shutterstock.com.

HRV biofeedback for heart failure patients represents a paradigm shift. Instead of only targeting sympathetic activation, HRV biofeedback teaches patients to restore autonomic balance by decreasing SNS arousal while simultaneously increasing PNS activity.
HRV Biofeedback is Like Weightlifting
Slow-paced breathing used in HRV biofeedback is like weightlifting. Graphic © pixelheadphoto digital skillet/Shutterstock.com.
.jpg)
Just as we only expect athletes to only lift weights during workouts, we don’t expect clients to walk around breathing at 6 bpm constantly. They do not have to continuously breathe at your RF to benefit from improved homeostatic regulation, regulatory capacity, and executive function. Continuous RF breathing would jeopardize homeostasis since breathing rate and volume should adjust to changing physical workloads across the day.

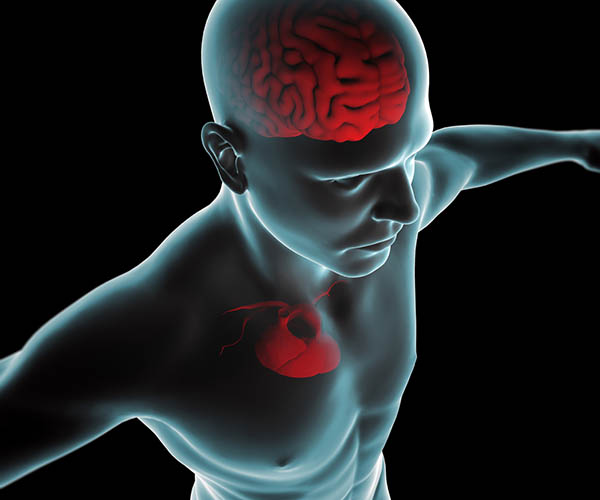
Heart-Brain Interactions
Thayer and Lane (2000) outline a neurovisceral integration model that describes how a central autonomic network (CAN) links the brainstem NST with forebrain structures (including the anterior cingulate, insula, ventromedial prefrontal cortex, the amygdala, and hypothalamus) through feedback and feed-forward loops. They speculate that a breakdown in negative feedback may produce the increased SNS arousal that characterizes anxiety disorders. Thayer et al. (2012, p. 754) contend that regions that include the amygdala and medial prefrontal cortex, which evaluate "threat and safety," help regulate HRV through their connections with the NST.
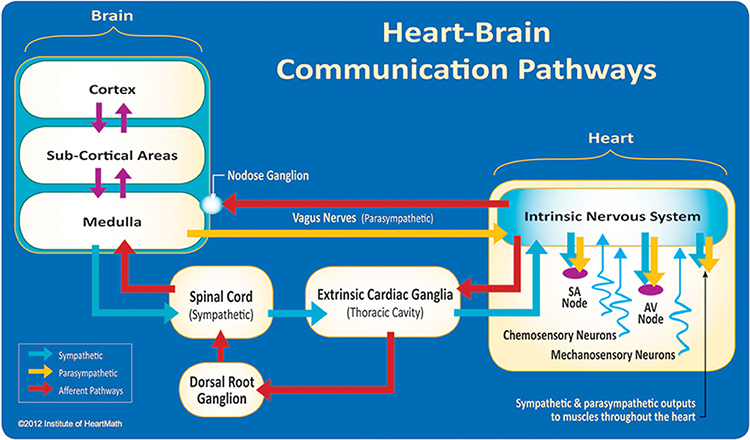
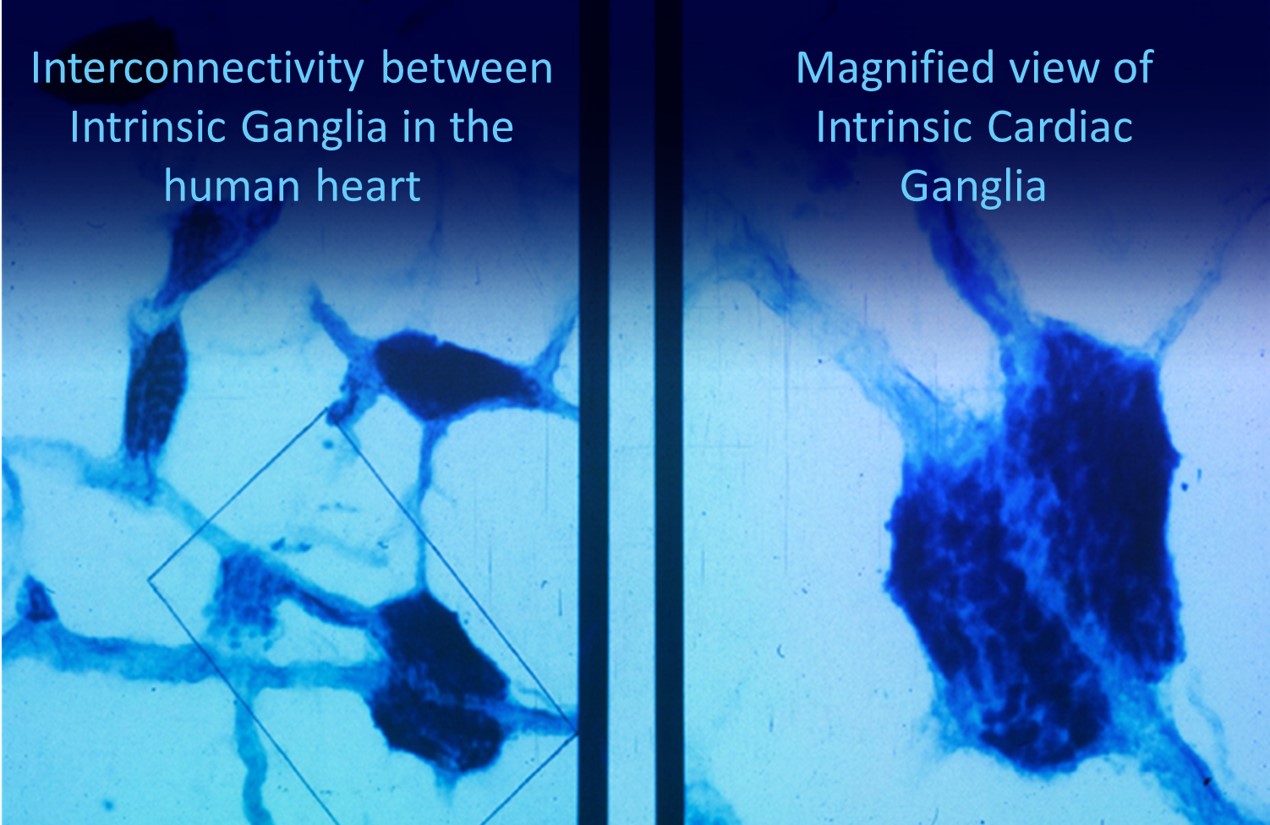
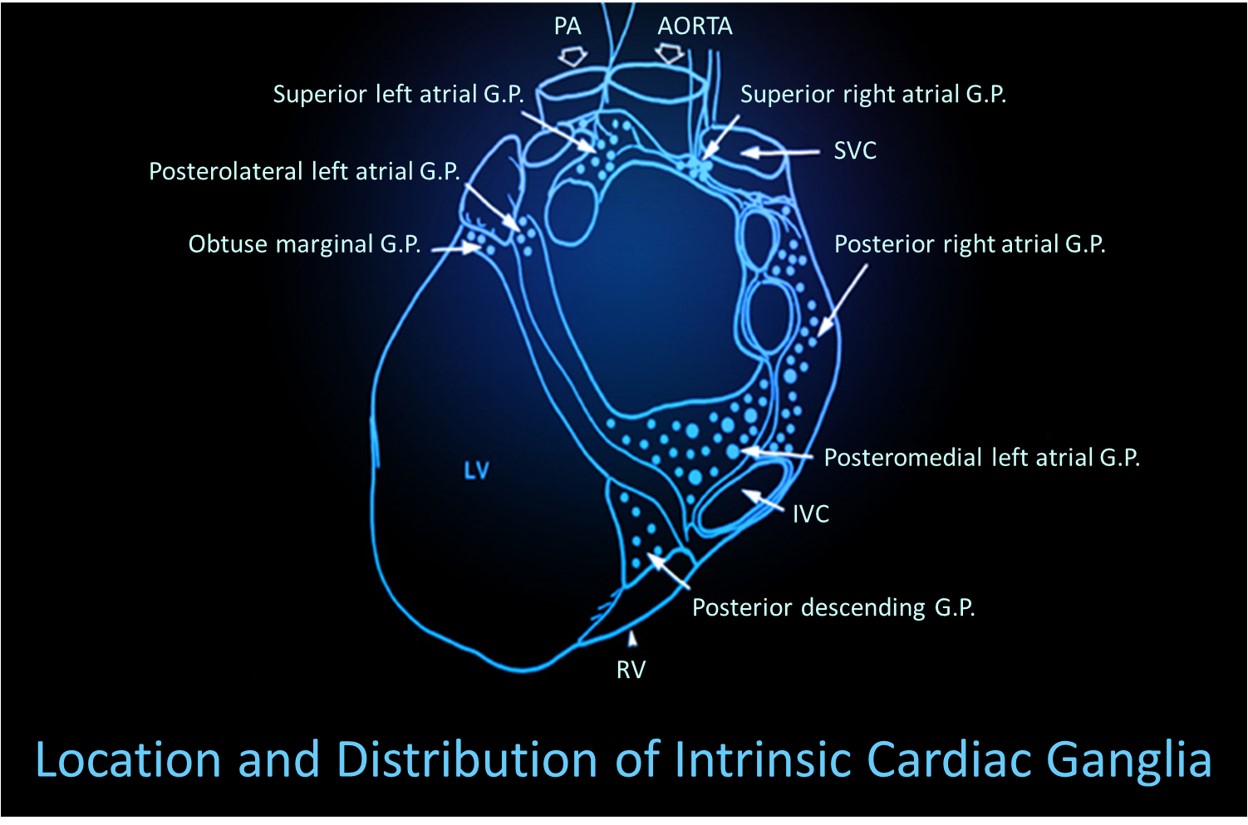
Shaffer, McCraty, and Zerr (2014) propose that interconnected cardiac ganglia create an intrinsic nervous system within the heart that influences the S-A and A-V node pacemakers and forms reciprocal connections with the extrinsic cardiac ganglia found in the chest cavity and the medulla. The sensory, interconnecting, afferent, and motor neurons within the heart can function independently and constitute a "little brain" on the mammalian heart.
Listen to a mini-lecture on Heart-Brain Interactions © BioSource Software LLC. Graphic © Naeblys/ Shutterstock.com.
The ascending afferent nerves help to regulate the heart and its rhythms physiologically and influence efferent SNS and PNS activity. From 85-90% of vagus nerve fibers are afferents, and more afferents from the heart target the brain than any other major organ.
Afferent signals from the intrinsic cardiac nervous system appear to affect attention, motivation, perceptual sensitivity, and emotional processing (Shaffer, McCraty, & Zerr, 2014). Graphic © 2012 Institute of HeartMath.
MacKinnon, Gevirtz, McCraty, and Brown (2013) reported that HRV influences the amplitude of heartbeat event-related potentials (HERPs). The amplitude of these negative EEG potentials that appear about 200-300 ms after each R-spike indexes cardiac afferent communication with the brain. Both negative and positive emotion conditions reduced HRV and HERP amplitude. In contrast, RF breathing increased HRV above baseline and increased HERP amplitude.
The authors speculated that RF breathing reduces interference with vagal afferent signal transmission from the heart to the cerebral cortex.
The following intrinsic ganglia images © 2012 Dr. Andrew Armour and the Institute of HeartMath.

HRV Myths

Misconception: Variability is bad; stability is good.
Greater variability in instantaneous HR is associated with greater health.
Misconception: The sympathetic nervous system plays a major role in short-term HRV.
Beat-to-beat HR variation is primarily parasympathetic. RSA and the baroreflex are the major PNS sources of brief HRV measurements.
Glossary
0.1 Hz biofeedback: training to concentrate ECG power around 0.1 Hz in the low frequency (LF) band by teaching patients to breathe diaphragmatically at their RF around 6 breaths per minute and to experience positive emotional tone to maximize heart rate variability.
abdominal excursion: the degree of outward and inward stomach movement across the breathing cycle.
baroreceptors: BP sensors located in the aortic arch and internal carotid arteries.
baroreceptor gain: increased baroreceptor sensitivity to BP changes.
baroreceptor reflex (baroreflex): a mechanism that provides negative feedback control of BP. Elevated BP activates the baroreflex to lower BP and low BP suppresses the baroreflex to raise BP.
chemoreceptor: sensors that detect oxygen and carbon dioxide in the blood to regulate gas concentration.
chaos: unpredictability due to non-linear dynamics.
cycle length dependence: the phenomenon where faster HRs reduce the time between successive beats and the opportunity for the interbeat intervals (IBIs) to vary, resulting in lower HRV.
epinephrine (E): an adrenal medullary hormone that increases muscle blood flow, converts stored nutrients into glucose for use by skeletal muscles, and initiates cardiac muscle contraction when it binds to β1 receptors.
fractals: infinitely complex geometric patterns that are self-similar across different scales.
frequency-domain measures of HRV: the absolute or relative power of the HRV signal within four frequency bands.
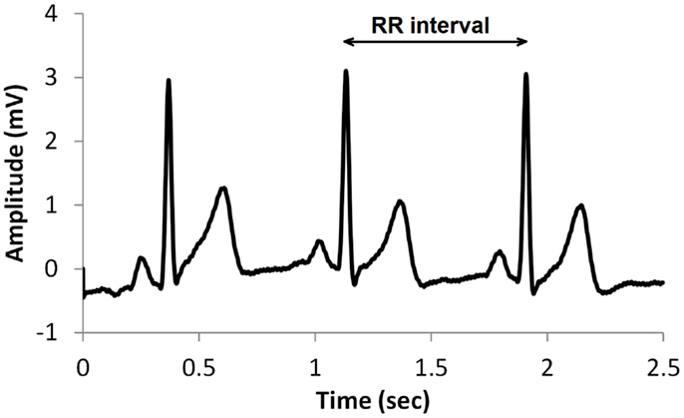
heart rate variability (HRV): the beat-to-beat changes in HR involving changes in the RR intervals between consecutive heartbeats.
high-frequency (HF) band: ECG frequency range from 0.15-0.40 Hz that represents the inhibition and activation of the vagus nerve by breathing (RSA).
homeostasis: a state of dynamic constancy achieved by stabilizing conditions about a setpoint, whose value may change over time.
interbeat interval (IBI): the time interval between the peaks of successive R-spikes (initial upward deflections in the QRS complex). This is also called the NN (normal-to-normal) interval after removing artifacts.
low-frequency (LF) band: an ECG frequency range of 0.04-0.15 Hz that may represent the influence of PNS, SNS, and baroreflex activity (when breathing at the RF).
norepinephrine (NE): an adrenal medullary hormone that initiates cardiac muscle contraction when it binds to β1 receptors.
nucleus ambiguus system: the nucleus dorsal to the inferior olivary nucleus of the upper medulla that gives rise to vagus nerve motor fibers.
resonance frequency: the frequency at which a system, like the cardiovascular system, can be activated or stimulated.
respiratory sinus arrhythmia (RSA): the respiration-driven heart rhythm that contributes to the high frequency (HF) component of heart rate variability. Inhalation inhibits vagal nerve slowing of the heart (increasing HR), while exhalation restores vagal slowing (decreasing HR).
resting baseline: breathing at typical rates without pacing or feedback.
spectral analysis: the division of heart rate variability into its component rhythms that operate within different frequency bands.
time-domain measures of HRV: indices like SDNN that measure the degree to which the IBIs between successive heartbeats vary.
ultra-low-frequency (ULF) band: an ECG frequency range below 0.003 Hz. Very slow biological processes that include circadian rhythms, core body temperature, metabolism, and the renin-angiotensin system, and possibly the PNS and SNS, generate ULF activity.
vagus nerve: the parasympathetic vagus (X) nerve decreases the rate of spontaneous depolarization in the SA and AV nodes and slows HR. Heart rate increases often reflect reduced vagal inhibition.
vascular tone (VT): the diameter of the blood vessels that regulate BP.
very-low-frequency (VLF): an ECG frequency range of 0.003-.04 Hz that may represent temperature regulation, plasma renin fluctuations, endothelial, physical activity influences, possible intrinsic cardiac nervous system, PNS, and SNS contributions.
REVIEW FLASHCARDS ON QUIZLET
Click on the Quizlet logo to review our chapter flashcards.

Assignment
Now that you have completed this module, monitor your HR as you inhale and exhale to observe your own RSA. What is the average difference between your fastest and slowest HRs across several breathing cycles? How has this unit changed how you might explain HRV and its potential benefits to a client.
References
Agelink, M., Boz, C., Ullrich, H., & Andrich, J. (2002). Relationship between major depression and heart rate variability. Clinical consequences and implications for antidepressive treatment. Psychiatry Research, 113(1), 139-149. https://doi.org/10.1016/s0165-1781(02)00225-1
Akselrod, S., Gordon, D., Ubel, F. A., Shannon, D. C., Berger, A. C., & Cohen, R. J. (1981). Power spectrum analysis of heart rate fluctuation: A quantitative probe of beat-to-beat cardiovascular control. Science, 213, 220-222. https://doi.org/10.1126/science.6166045
Beckers, F., Verheyden, B., & Aubert, A. E. (2006). Aging and nonlinear heart rate control in a healthy population. Am J Physiol Heart Circ Physiol, 290, H2560-H2570. https://doi.org/0.1152/ajpheart.00903.2005
Bernardi, L., Valle, F., Coco, M., Calciati, A., & Sleight, P. (1996). Physical activity influences heart rate variability and very-low-frequency components in Holter electrocardiograms. Cardiovascular Research, 32, 234-237. https://doi.org/10.1016/0008-6363(96)00081-8
Bernardi, L., Gabutti, A., Porta, C., & Spicuzza, L. (2001). Slow breathing reduces chemoreflex response to hypoxia and hypercapnia, and increases baroreflex sensitivity. Journal of Hypertension, 19(12), 2221-2229. https://doi.org/10.1097/00004872-200112000-00016
Berntson, G. G., Bigger, J. T., Eckberg, D. L., Grossman, P., Kaufmann, P. G., Malik, M., Nagaraja, H. N., Porges, S. W., Saul, J. P., Stone, P. H., & van der Molen, M. W. (1997). Heart rate variability: Origins, methods, and interpretive caveats. Psychophysiology, 34(6), 623-648. https://doi.org/10.1111/j.1469-8986.1997.tb02140.x
Berntson, G. G., Quigley, K. S., & Lozano, D. (2007). Cardiovascular psychophysiology. In J. T. Cacioppo, L. G. Tassinary, & G. G. Berntson (Eds.). Handbook of psychophysiology (3rd ed.). New York: Cambridge University Press.
Bigger, J., Fleiss, J., Rolnitzky, L., & Steinman, R. (1993). The ability of several short-term measures of RR variability to predict mortality after myocardial infarction. Circulation, 88, 927-934. https://doi.org/10.1161/01.cir.88.3.927
Bigger, J., Fleiss, J., Steinman, R., Rolnitzky, L., Kleiger, R., & Rottman, J. (1992). Frequency domain measures of heart period variability and mortality after myocardial infarction. Circulation, 85, 164-171. https://doi.org/10.1161/01.cir.85.1.164
Bigger, J. T., Fleiss, J. L., Steinman, R. C., Rolnitzky, L. M., Schneider, W. J., & Stein, P. K. (1995). RR variability in healthy, middle-aged persons compared with patients with chronic coronary heart disease or recent acute myocardial infarction. Circulation, 91(7), 1936-1943. https://doi.org/10.1161/01.cir.91.7.1936
Carney, R. M., Blumenthal, J. A., Stein, P. K., Watkins, L., Catellier, D., Berkman, L. F., Czajkowskim S. M., O'Connor, C., Stone, P. H., & Freedland, K. E. (2001). Depression, heart rate variability, and acute myocardial infarction. Circulation, 104(17), 2024-2028. https://doi.org/10.1161/hc4201.097834
Casolo, G., Balli, E., Taddei, T., Amuhasi, J., & Gori, C. (1989). Decreased spontaneous heart rate variability in congestive heart failure. The American Journal of Cardiology, 64(18), 1162-1167. https://doi.org/10.1016/0002-9149(89)90871-0
Cohen, H., & Benjamin, J. (2006). Power spectrum analysis and cardiovascular morbidity in anxiety disorders. Autonomic Neuroscience: Basic and Clinical, 128, 1–8. https://doi.org/10.1016/j.autneu.2005.06.007
Dahr, A. K., Lambert, G. W., & Barton, D. A. (2016). Depression and cardiovascular disease: Psychopbiological mechanisms. In M. E. Alvarenga, & D. Byrne (Eds.). Handbook of psychocardiology. Singapore: Springer Singapore.
DeBoer, R. W., Karemaker, J. M., & Strackee, J. (1987). Hemodynamic fluctuations and baroreflex sensitivity in humans: A beat-to-beat model. American Journal of Physiology—Heart and Circulatory Physiology, 253(22), H680-H689. https://doi.org/10.1152/ajpheart.1987.253.3.h680
Del Pozo, J. M., & Gevirtz, R. N. (2003). Complementary and alternative care for heart disease. Biofeedback, 31(3), 16-17.
Del Pozo, J. M., Gevirtz, R. N., Scher, B., & Guarneria, E. (2004). Biofeedback treatment increases heart rate variability in patients with known coronary artery disease. American Heart Journal, 147(3), G1-G6. https://doi.org/10.1016/j.ahj.2003.08.013
Ewing, D. J., Campbell, I. W., & Clarke, B. F. (1976). Mortality in diabetic autonomic neuropathy. Lancet, 1, 601–603. https://doi.org/10.1016/S0140-6736(76)90413-X
Gass, J. J., & Glaros, A. G. (2013). Autonomic dysregulation in headache patients. Applied Psychophysiology & Biofeedback, 38, 257-263. https://doi.org/10.1007/s10484-013-9231-8
Gevirtz, R. (2013). The nerve of that disease: The vagus nerve and cardiac rehabilitation. Biofeedback, 41(1), 32-38. http://dx.doi.org/10.5298/1081-5937-41.1.01
Gevirtz, R. N. (2000). Resonant frequency training to restore homeostasis for treatment of psychophysiological disorders. Biofeedback, 27, 7-9.
Gevirtz, R. N. (2003). The promise of HRV biofeedback: Some preliminary results and speculations. Biofeedback, 31(3), 18-19.
Gevirtz, R. N. (2005). Heart rate variability biofeedback in clinical practice. AAPB Fall workshop.
Gevirtz, R. N. (2017). Cardio-respiratory psychophysiology: Gateway to mind-body medicine.
Gevirtz, R. N., & Lehrer, P. (2003). Resonant frequency heart rate biofeedback. In M. S. Schwartz, & F. Andrasik (Eds.). Biofeedback: A practitioner's guide (3rd ed.). The Guilford Press.
Gevirtz, R. N., Lehrer, P. M., & Schwartz, M. S. (2016). Cardiorespiratory biofeedback. In M. S. Schwartz & F. Andrasik (Eds.). Biofeedback: A practitioner’s guide (4th ed.). The Guilford Press.
Giardino, N. D., Chan, L., & Borson, S. (2004). Combined heart rate variability and pulse oximetry biofeedback for chronic obstructive pulmonary disease. Applied Psychophysiology and Biofeedback, 29(2), 121-133. https://doi.org/10.1023/b:apbi.0000026638.64386.89
Ginsberg, J. P., Berry, M. E., & Powell, D. A. (2010). Cardiac coherence and posttraumatic stress disorder in combat veterans. Alternative Therapies, 16(4), 52-60.
Goldstein, D. S., Bentho, O., Park, M. Y., & Sharabi, Y. (2011). Low frequency power of heart rate variability is not a measure of cardiac sympathetic tone but may be a measure of modulation of cardiac autonomic outflows by baroreflexes. Exp Physiol, 96(12), 1255-1261. PMID: 20653296
Herbs, D., Gevirtz, R. N., & Jacobs, D. (1994). The effect of heart rate pattern biofeedback for the treatment of essential hypertension [Abstract]. Biofeedback and Self-regulation, 19(3), 281.
Imahori, Y., Vetrano, D. L., Xia, X., Grande, G., Ljungman, P., Fratiglioni, L., & Qui, C. (2021). Association of resting heart rate with cognitive decline and dementia in older adults: A population-based cohort study. Alzheimer's & Dementia. https://doi.org/10.1002/alz.12495
Karemaker, J. M. (2009). Counterpoint: Respiratory sinus arrhythmia is due to the baroreflex mechanism. Journal of Applied Psychology, 106(5), 1742–1743. https://doi.org/10.1152/japplphysiol.91107.2008a
Kazuma, N., Otsuka, K., Matsuoka, I., & Murata, M. (1997). Heart rate variability during 24 hours in asthmatic children. Chronobiol Int, 14, 597–606. https://doi.org/10.3109/07420529709001450
Kleiger, R. E., Miller, J. P., Bigger, J. T., & Moss, A. J. (1987). Decreased heart rate variability and its association with increased mortality after acute myocardial infarction. American Journal of Cardiology, 59, 256-262. https://doi.org/10.1016/0002-9149(87)90795-8
Lehrer, P. M. (2007). Biofeedback training to increase heart rate variability. In P. M. Lehrer, R. M. Woolfolk, & W. E. Sime (Eds.). Principles and practice of stress management (3rd ed.). The Guilford Press.
Lehrer, P. M. (2012). Personal communication.
Lehrer, P. M. (2013). How does heart rate variability biofeedback work? Resonance, the baroreflex, and other mechanisms. Biofeedback, 41(1), 26-31. https://doi.org/10.5298/1081-5937-41.1.02
Lehrer, P. M., & Eddie, D. (2013). Dynamic processes in regulation and some implications for biofeedback and biobehavioral interventions. Applied Psychophysiology & Biofeedback, 38, 143-155. https://doi.org/10.1007/s10484-013-9217-6
Lehrer, P. M., & Gevirtz, R. (2021). BCIA HRV Biofeedback didactic workshop. Association for Applied Psychophysiology and Biofeedback.
Lehrer, P., Karavidas, M. K., Lu, S. E., Coyle, S. M., Oikawa, L. O., Macor, M., Calvano, S. E., & Lowry, S. F. (2010). Voluntarily produced increases in heart rate variability modulate autonomic effects of endotoxin induced systemic inflammation: An exploratory study. Applied Psychophysiology and Biofeedback, 35(4), 303-315. https://doi.org/10.1007/s10484-010-9139-5
Lehrer, P. M., Smetankin, A., & Potapova, T. (2000). Respiratory sinus arrhythmia biofeedback therapy for asthma: A report of 20 unmedicated pediatric cases using the Smetankin method. Applied Psychophysiology and Biofeedback, 25, 193-200. https://doi.org/10.1023/a:1009506909815
Lehrer, P. M., & Vaschillo, E. (2008). The future of heart rate variability biofeedback. Biofeedback, 36(1), 11-14.
Lehrer, P. M., Vaschillo, E., Vaschillo, B., Lu, S. E., Eckberg, D. L., Edelberg, R., Shih, W. J., Lin, Y., Kuusela, T. A., Tahvanainen, K. U. O., & Hamer, R. M. (2003). Heart rate variability biofeedback increases baroreflex gain and peak expiratory flow. Psychosomatic Medicine, 65, 796-805. https://doi.org/10.1097/01.psy.0000089200.81962.19
Lehrer, P. M., Vaschillo, E. V., & Vaschillo, B. (2004). Heartbeat synchronizes with respiratory rhythm only under specific circumstances. Chest, 126(4), 1385-1386. https://doi.org/10.1016/S0012-3692(15)31329-5
Lehrer, P., Vaschillo, E., Vaschillo, B., Lu, S-E, Scardella, A., Siddique, M, & Habib, R. (2004). Biofeedback treatment for asthma. Chest, 126, 352-361. https://doi.org/10.1378/chest.126.2.352
Lehrer, P., Vaschillo, B., Zucker, T., Graves, J., Katsamanis, M., Aviles, M., & Wamboldt, F. (2013). Protocol for heart rate variability biofeedback training. Biofeedback, 41(3), 98-109.
MacLean, B. (2004). The heart and the breath of love. Biofeedback, 32(4), 21-25.
Maver, J., Strucl, M., & Accetto, R. (2004). Autonomic nervous system activity in normotensive subjects with a family history of hypertension. Clinical Autonomic Research: Official Journal of the Clinical Autonomic Research Society, 14(6), 369-375. https://doi.org/10.1007/s10286-004-0185-z
McCraty, R., Atkinson, M., Tiller, W. A. (1995). The effects of emotions on short term power spectrum analysis of heart rate variability. American Journal of Cardiology, 76. https://doi.org/10.1016/s0002-9149(99)80309-9
McCraty, R., Atkinson, M., Tomasino, D., & Bradley, R. T. (2006). The coherent heart. Boulder Creek, CA: Institute of HeartMath.
McCraty, R., Atkinson M, Tomasino, D., & Bradley, R. T. (2009). The coherent heart: Heart-brain interactions, psychophysiological coherence, and the emergence of system-wide order. Integral Review, 5(2), 10-115.
McCraty, R. & Shaffer, F. (2015). Heart rate variability: New perspectives on physiological mechanisms, assessment of self-regulatory capacity, and health risk. Glob Adv Health Med, 4(1). 46-61. https://doi.org/10.7453/gahmj.2014.073
Moravec, C. S., & McKee, M. G. (2013). Biofeedback in heart failure: Psychophysiologic remodeling of the failing heart. Biofeedback, 41(1), 7-12. http://dx.doi.org/10.5298/1081-5937-41.1.04
Moss, D. (2004). Heart rate variability (HRV) biofeedback. Psychophysiology Today, 1, 4-11.
Nolan, J., Flapan, A. D., Capewell, S., MacDonald, T. M., Neilson, J. M., & Ewing, D. J. (1992). Decreased cardiac parasympathetic activity in chronic heart failure and its relation to left ventricular function. Br Heart J, 67(6), 482-485. https://doi.org/10.1136/hrt.67.6.482
Nunan, D., Sandercock, G. R. H., & Brodie, D. A. (2010). A quantitative systematic review of normal values for short-term heart rate variability in healthy adults. Pacing and Clinical Electrophysiology, 33(11), 1407-1417. https://doi.org/10.1111/j.1540-8159.2010.02841.x
Ogletree-Hughes, M. L., Stull, L. B., Sweet, W. E., Smedira, N. G., McCarthy, P. M., & Moravec, C. S. (2001). Mechanical unloading restores beta-adrenergic responsiveness and reverses receptor down-regulation in the failing human heart. Circulation, 104, 881-886. https://doi.org/10.1161/hc3301.094911
Olshansky, B., Sabbah, H. N., Hauptman, P. J., & Colucci, W. S. (2008). Parasympathetic nervous system and heart failure: Pathophysiology and potential implications for therapy. Circulation, 118, 863-871. https://doi.org/10.1161/circulationaha.107.760405
Opthof, T. (2000). The normal range and determinants of the intrinsic heart rate in man. Cardiovascular Research, 45, 177-184. PMID: 10728332
Papillo, J. F., & Shapiro, D. (1990). The cardiovascular system. In J. T. Cacioppo & L. G. Tassinary (Eds.) Principles of psychophysiology: Physical, social, and inferential elements (pp. 456 - 512). Cambridge University Press.
Peper, E., Harvey, R., Lin, I., Tylova, H., & Moss, D. (2007). Is there more to blood volume pulse than heart rate variability, respiratory sinus arrhythmia, and cardio-respiratory synchrony? Biofeedback, 35(2), 54-61.
Poole, L., Dickens, C., & Steptoe, A. (2011). The puzzle of depression and acute coronary syndrome: Reviewing the role of acute inflammation. Journal of Psychosomatic Research, 71(2), 61-68.
Porges, S. W. (2011). The polyvagal theory: Neurophysiological foundations of emotions, attachment, communication, and self-regulation. W. W. W. Norton & Company.
Ridker, P. M., Rifai, N., Stampfer, M. J., & Hennekens, C. H. (2000). Plasma concentration interleukin-6 and the risk of future myocardial infarction among apparently healthy men. Circulation, 101(15), 1767-1772. https://doi.org/10.1161/01.CIR.101.15.1767
Roach, D., Wilson, W., Ritchie, D., & Sheldon, R. (2004). Dissection of long-range heart rate variability: Controlled induction of prognostic measures by activity in the laboratory. J Am Coll Cardiol, 43(12), 2271-2277. https://doi.org/10.1016/j.jacc.2004.01.050
Schmidt, J. E., Carlson, C. R. (2009). A controlled comparison of emotional reactivity and physiological response in masticatory muscle pain patients. Journal of Orofacial Pain, 23, 230-242. PMID: 19639103
Schwartz, S. (2015). Viva vagus: Wandering nerve could lead to range of therapies. Science News, 188(11), 18.
Shaffer, F., & Combatalade, D. C. (2013). Don't add or miss a beat: A guide to cleaner heart rate variability recordings. Biofeedback, 41(3), 121-130.
Shaffer, F., McCraty, R., & Zerr, C. L. (2014). A healthy heart is not a metronome: An integrative review of the heart’s anatomy and heart rate variability. Frontiers in Psychology. doi:10.3389/fpsyg.2014.01040
Shaffer, F., Meehan, Z. M., & Zerr, C. L. (2020). A critical review of ultra-short-term heart rate variability norms research. Frontiers in Neuroscience.
Shaffer, F., & Moss, D. (2006). Biofeedback. In Y. Chun-Su, E. J. Bieber, & B. Bauer (Eds.). Textbook of complementary and alternative medicine (2nd ed.). Informa Healthcare.
Stauss, H. M. (2003). Heart rate variability. Am J Physiol Regul Integr Comp Physiol, 285, R927-R931. https://doi.org/10.1152/ajpregu.00452.2003
Task Force of the European Society of Cardiology and the North American Society of Pacing and Electrophysiology (1996). Heart rate variability: Standards of measurement, physiological interpretation, and clinical use. Circulation, 93, 1043-1065. PMID: 8598068
Taylor, J. A., Carr, D. L., Myers, C. W., & Eckberg, D. L. (1998). Mechanisms underlying very-low-frequency RR-interval oscillations in humans. Circulation, 98, 547-555. https://doi.org/10.1161/01.cir.98.6.547
Taylor, S. E. (2006). Tend and befriend: Biological bases of affiliation under stress. Current Directions in Psychological Science, 15(6), 273-277. https://doi.org/10.1111/j.1467-8721.2006.00451.x
Thayer, J. F., Ahs, F., Fredrikson, M., Sollers, J. J., & Wager, T. D. (2012). A meta-analysis of heart rate variability and neuroimaging studies: Implications for heart rate variability as a marker of stress and health. Neuroscience and Biobehavioral Reviews, 36, 747-756. https://doi.org/10.1016/j.neubiorev.2011.11.009
Thayer, J. F., & Lane, R. D. (2000). A model of neurovisceral integration in emotion regulation and dysregulation. Journal of Affective Disorders, 61, 201-216. https://doi.org/10.1016/s0165-0327(00)00338-4
Thayer, J. F., Yamamoto, S. S., & Brosschot, J. F. (2010). The relationship of autonomic imbalance, heart rate variability and cardiovascular disease risk factors. Int J Cardiol, 141(2), 122-131. https://doi.org/10.1016/j.ijcard.2009.09.543
Umetani, K., Singer, D. H., McCraty, R., & Atkinson, M. (1998). Twenty-four hour time domain heart rate variability and heart rate: Relations to age and gender over nine decades. Journal of the American College of Cardiology, 31(2), 593-601. https://doi.org/10.1016/s0735-1097(97)00554-8
Vaillancourt, D. E., & Newell, K. M. (2002). Changing complexity in human behavior and physiology through aging and disease. Neurobiology of Aging, 23, 1-11. https://doi.org/10.1016/s0197-4580(01)00247-0
Vaschillo, E., Lehrer, P., Rishe, N., & Konstantinov, M. (2002). Heart rate variability biofeedback as a method for assessing baroreflex function: A preliminary study of resonance in the cardiovascular system. Applied Psychophysiology and Biofeedback, 27, 1-27. https://doi.org/10.1023/a:1014587304314
Vaschillo, E., Vaschillo, B., & Lehrer, P. (2004). Heartbeat synchronizes with respiratory rhythm only under specific circumstances. Chest, 126, 1385-1386. https://doi.org/10.1016/S0012-3692(15)31329-5
Vaschillo, E. G., Vaschillo, B., Pandina, R. J., & Bates, M. E. (2011). Resonances in the cardiovascular system caused by rhythmical muscle tension. Psychophysiology, 48, 927-936. https://doi.org/10.1111/j.1469-8986.2010.01156.x
Wolf, M. M., Varigos, G. A., Hunt, D., & Sloman, J. G. (1978). Sinus arrhythmia in acute myocardial infarction. Med J Australia, 2, 52-53. https://doi.org/10.5694/j.1326-5377.1978.tb131339.x
Yasuma, F., & Hayano, J. (2004). Respiratory sinus arrhythmia: Why does the heartbeat synchronize with respiratory rhythm? Chest, 125(2), 683-690. https://doi.org/10.1378/chest.125.2.683
Zhang, D., Shen, X., & Qi, X. (2016). Resting heart rate and all-cause and cardiovascular mortality in the general population: A meta-analysis. CMAJ, 188(3), E53-63. https://doi.org/10.1503/cmaj.150535
B. HRV TIME-DOMAIN MEASUREMENTS
Normative heart rate variability (HRV) values only apply when clients breathe at average rates (Shaffer & Ginsberg, 2017).
HRV time-domain indices quantify the amount of variability in measurements of the interbeat interval (IBI), which is the period between successive heartbeats. An IBI is called an R-R interval because it is the time between adjacent R-spikes. Graphic © arka38/Shutterstock.com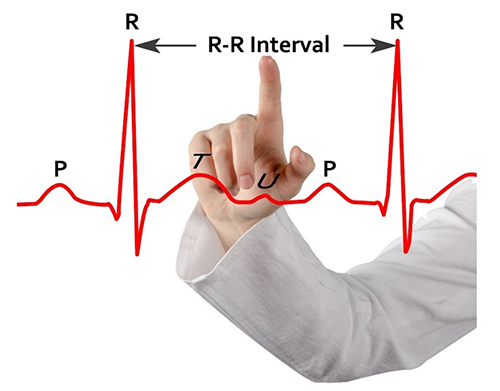
We measure the time intervals between successive heartbeats in milliseconds (ms). The software starts counting after detecting the first beat and calculates the first IBI in milliseconds after detecting the second beat. This process is repeated until the end of the epoch or data collection period. Graphic courtesy of Dick Gevirtz.
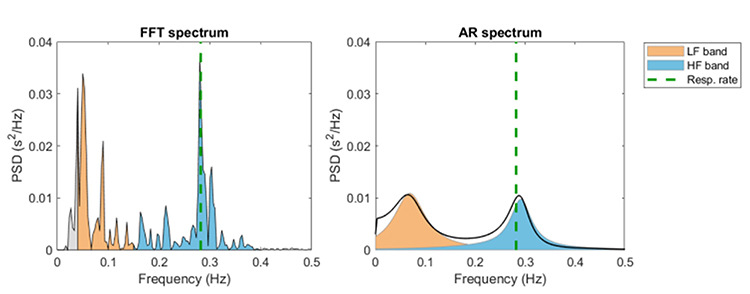
In contrast, HRV frequency-domain measurements calculate the absolute or relative amount of signal power in the ULF, VLF, LF, and HF bands. The graphic below shows two methods of measuring the spectral distribution of HRV power (FFT and Autoregression). The graphic is courtesy of Tarvainen and Niskanen (2020).
This section covers the SDNN, SDRR, SDANN, pNN50, NN50, HR Max - HR Min, RMSSD, and HRV triangular index.
SDNN
The SDNN is the standard deviation of the interbeat interval of normal sinus beats measured in milliseconds (ms). "Normal" means that abnormal beats, like ectopic beats, have been removed. The related SDSD, the standard deviation of successive RR interval differences, only represents short-term variability.
SDNN is calculated using data that are free of artifacts and abnormal heartbeats.
Both SNS and PNS activity contribute to SDNN, and it is highly correlated with ULF, VLF, LF band power, and total power (Umetani et al., 1998). This relationship depends on the measurement conditions. When these bands have greater power than the HF band, they contribute more to SDNN.In short-term (≤ 5 minutes) resting recordings, the primary source of the variation is parasympathetically-mediated RSA, especially with slow-paced breathing protocols (Shaffer, McCraty, & Zerr, 2014).
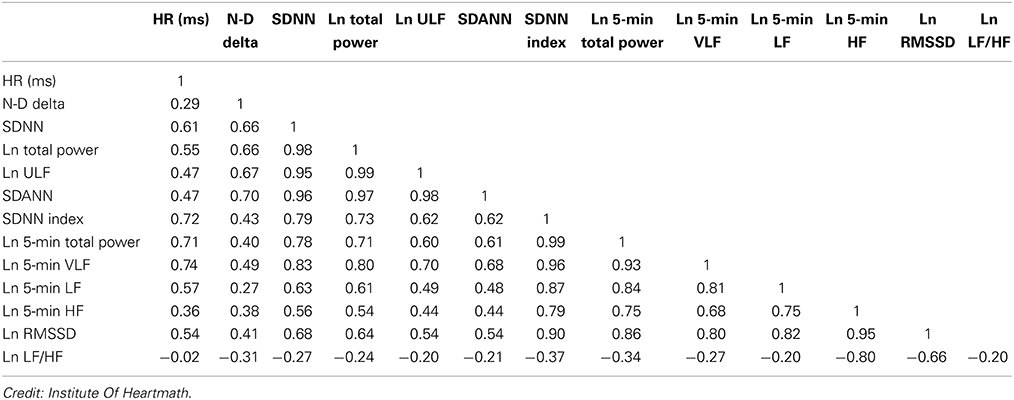
In 24-hour recordings, LF band power contributes significantly to SDNN (Kusela, 2013). The following table shows the correlations between time- and frequency-domain measures in 24-hour recordings and is provided courtesy of the Institute of HeartMath (Shaffer, McCraty, & Zerr, 2014).
Why 24 Hour Recording is More Accurate
The SDNN is more accurate when calculated over 24 hours than during the shorter periods monitored during biofeedback sessions. More extended recording periods provide data about cardiac reactions to a greater range of environmental stimulation. In addition to cardiorespiratory regulation, extended measurement periods can index the heart's response to changing workloads, anticipatory central nervous activity involving classical conditioning, and circadian processes, including sleep-wake cycles (Lehrer, 2012). Twenty-four-hour recordings reveal the SNS contribution to HRV (Grant et al., 2011).While the conventional brief recording standard is 5 minutes, researchers have proposed ultra-short-term (UST) recording periods from 60 (Salahuddin et al., 2007; Shaffer, Meehan, & Zerr, 2020) to 240 seconds (Baek et al., 2015).
24-Hour SDNN Predicts Mortality
The SDNN is the "gold standard" for medical stratification of cardiac risk when recorded 24 hours (Task Force, 1996). SDNN values predict both morbidity and mortality. Based on 24-hour monitoring, patients with SDNN values below 50 milliseconds are classified as unhealthy, 50-100 milliseconds have compromised health, and above 100 milliseconds are healthy.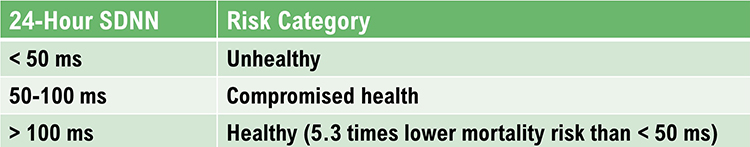
Heart attack survivors, whose 24-hour measurements placed them in a higher category, had a greater probability of living during a 31-month mean follow-up period. For example, patients with SDNN values over 100 milliseconds had 5.3 times lower mortality risk at follow-up than those under 50 milliseconds (Kleiger et al., 1987). Does this mean that training patients to increase SDNN to a higher category could reduce their mortality risk?
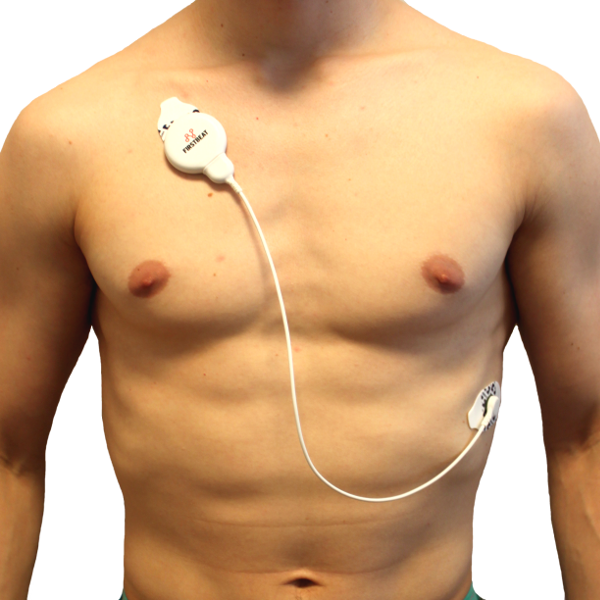
An ECG sensor designed for ambulatory 24-hour monitoring is shown below.
 |
 |
SDRR
The SDRR is the standard deviation of the interbeat interval for all sinus beats (including abnormal or false beats) measured in ms. As with the SDNN, the SDRR calculates how these intervals vary over time. The SDRR is also more accurate when calculated over 24 hours. Abnormal beats may reflect cardiac dysfunction or noise that masquerades as HRV. Below is a heart rate variability display. The roller coaster accelerates as SDRR increases.
SDANN
The SDANN is the standard deviation of the average NN intervals for each of the 5-minute segments during a 24-hour recording. NN intervals stands for normal-to-normal intervals. These are "clean" IBIs calculated after artifacting the data. The SDANN estimates heart rate (HR) changes produced by cycles longer than 5 minutes. Like the SDNN, it is measured and reported in milliseconds. This index is correlated with the SDNN and is generally considered redundant (Shaffer, McCraty, & Zerr, 2014). Minimum HR is more strongly associated with Ln SDANN than Ln RMSSD. Ln means the natural logarithm. Maximum heart rate is weakly and inconsistently correlated with these time-domain measures (Burr et al., 2006).
SDNN Index (SDNNI)
The SDNN Index (SDNNI) is the mean of the standard deviations of all the NN intervals for each 5-minute segment of a 24-hour HRV recording. Therefore, this measurement only estimates variability due to the factors affecting HRV within 5 minutes. It is calculated by dividing the 24-hour record into 288 5-minute segments and then calculating the standard deviation of all NN intervals within each segment. The SDNNI is the average of these 288 values.
The SDNNI is believed to measure autonomic influence on HRV primarily. The SDNNI tends to correlate with VLF power over over 24 hours (Shaffer, McCraty, & Zerr, 2014).
NN50
The NN50 measures the number of adjacent NN intervals that differ by more than 50 milliseconds. At least a 2-minute sample is required.
pNN50
The pNN50 is the percentage of adjacent NN intervals that differ from each other by more than 50 milliseconds. While the conventional minimum recording is 5 minutes, researchers have proposed UST periods of 10 seconds (Salahuddin et al., 2007), 30 seconds (Baek et al., 2015), and 60 seconds (Shaffer, Meehan, & Zerr, 2020).
The pNN50 is closely correlated with PNS activity (Umetani et al., 1998). It is correlated with the RMSSD and HF power. However, the RMSSD typically provides a better assessment of RSA (especially in older subjects), and most researchers prefer it to the pNN50 (Otzenberger et al., 1998). The pNN50 may be a more reliable index than short-term SDNN measurements for the brief samples used in biofeedback.
HR Max-HR Min
HR Max – HR Min is the average difference between the highest and lowest heart rates during each respiratory cycle. At least a 2-minute sample is required to calculate HR Max – HR Min. Physically active individuals show wider peak-trough differences than those who are sedentary.
HR Max-HR Min is Affected by Breathing Rate and Measures RSA
This index is susceptible to the effects of respiration rate, independent of vagus nerve traffic. Instead of directly indexing vagal tone, it reflects RSA. HR Max-HR Min depends on age and fitness. Since longer exhalations allow greater acetylcholine metabolism, slower respiration rates can produce higher RSA amplitudes that are not mediated by changes in vagal firing (Lehrer, 2012).Booiman (2017) reported values in the 30- and 40-bpm range for Dutch clients in their teens and twenties during slow-paced breathing. For example, the screen capture below is from a 16-year-old female client, 2 weeks post-concussion, who achieved a HR Max-HR Min value of 30 bpm while breathing at 5.5 breaths per minute. Graphic courtesy of Annette Booiman.
HR Max-HR Min can reach 50 beats per minute for elite athletes. This measure is used for HRV assessment in paced breathing protocols and is highly correlated with the SDNN and RMSSD (Shaffer, McCraty, & Zerr, 2014).
RMSSD
The RMSSD is the root mean square of successive differences between normal heartbeats. This value is obtained by first calculating each subsequent time difference between adjacent interbeat intervals in milliseconds. Then, each of these values is squared, and the result is averaged before the square root of the total is obtained.
The RMSSD reflects rapid beat-to-beat variance in HR and better estimates vagal activity than SDNN (Shaffer, McCraty, & Zerr, 2014). The RMSSD is conceptualized as vagally-mediated HRV (vmHRV; Jarczock et al., 2021). The RMSSD is the best overall measure of short-term HRV because it is less affected by outliers and artifacts than SDNN (Gevirtz, 2020). A novel ratio of short-term RMSSD and C-reactive protein predicted survival in cancer patients and the general population (Jarczock et al., 2021). At least a 5-minute sample is required. Researchers have proposed UST periods of 10 seconds (Salahuddin et al., 2007), 30 seconds (Baek et al., 2015), and 60 seconds (Shaffer, Meehan, & Zerr, 2020).
The RMSSD is identical to the nonlinear metric SD1, reflecting short-term HRV (Ciccone et al., 2017). While the RMSSD is correlated with HF power (Kleiger et al., 2005), the influence of respiration rate on this index is uncertain (Schipke et al., 1999; Pentillä et al., 2001). The RMSSD is less affected by respiration than is RSA across several tasks (Hill & Siebenbrock, 20009). The RMSSD is more influenced by the PNS than SDNN (Gevirtz, 2017).
Lower RMSSD values are correlated with higher scores on a risk inventory of sudden unexplained death in epilepsy (DeGiorgio et al., 2010).
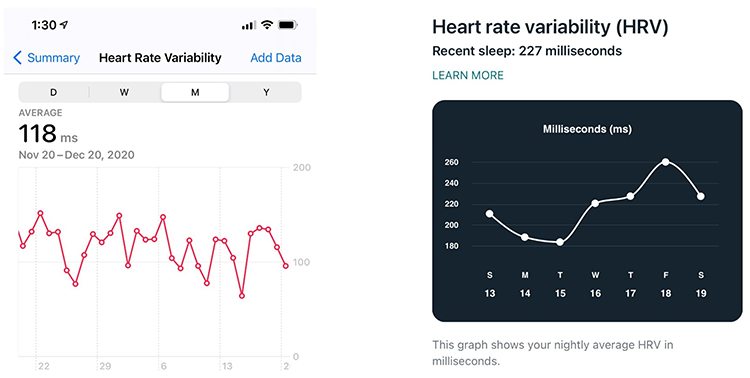
Many HRV apps (Apple Health, Elite HRV, Fitbit) use RMSSD or Ln RMSSD to measure HRV. Ln means the natural logarithm.
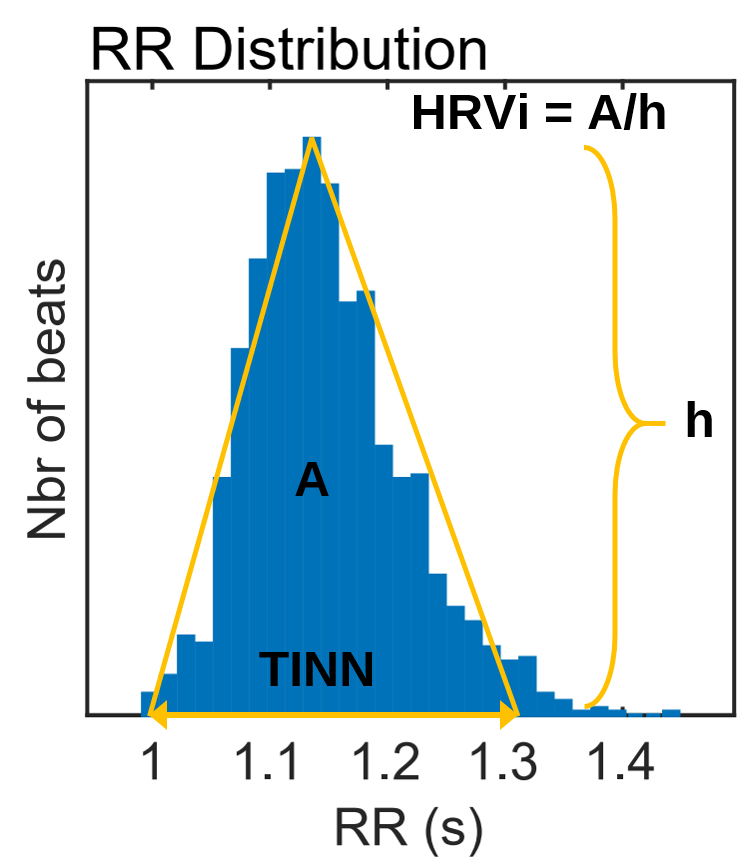
HRV Triangular Index
The HRV triangular index (HTI) is a geometric measure based on 24-hour recordings, which calculates the integral of the RR interval histogram's density divided by its height (Task Force, 1996). Graphic retrieved from vippng.com.
Both the PNS and SNS contribute to the HRV triangular index (Billman et al., 1982; Schwartz et al., 1988). A 5-minute epoch may be sufficient to represent this metric (Jovic & Bogunovic, 2011). A 120-second UST period estimated this metric (Shaffer, Meehan, & Zerr, 2020).
HTI and RMSSD can jointly distinguish between normal heart rhythms and arrhythmias (Jovic & Bogunovic, 2011). The HTI independently predicts mortality in patients diagnosed with atrial fibrillation (Hämmerle et al., 2020). When HTI ≤ 20.42 and RMSSD ≤ 0.068, the heart rhythm is normal. When HTI > 20.42, the rhythm is arrhythmic (Jovic & Bogunovic, 2011).
Summary Tables
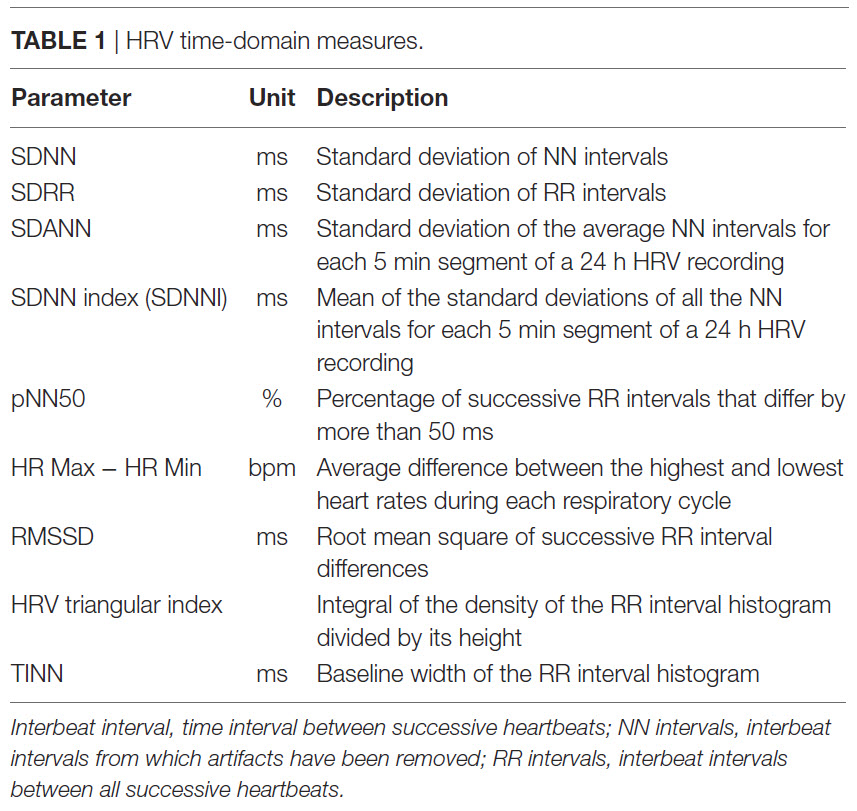
Table 2 shows the minimum conventional and UST recording periods (Shaffer, Meehan, and Zerr, 2020).
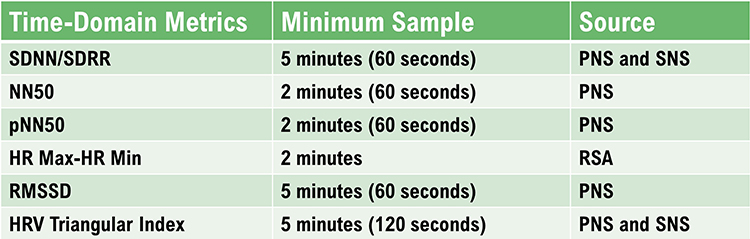
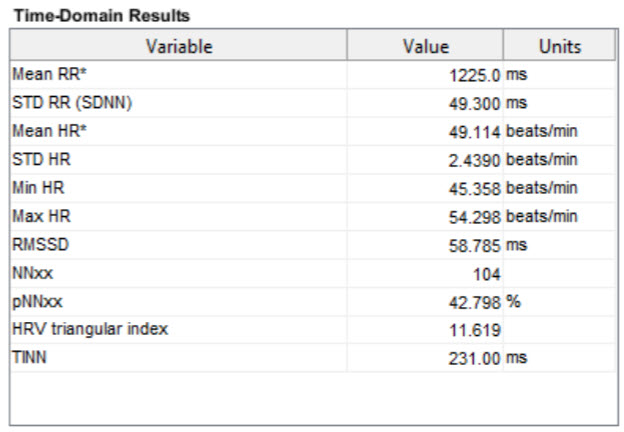
Table 3 displays Kubios time-domain calculations after artifact correction.
The Triangular Interpolation of the NN Interval Histogram
The Triangular Interpolation of the NN Interval Histogram (TINN) is the baseline width of a histogram displaying NN intervals. To unpack this definition, visualize a histogram that plots the frequency of NN intervals. The X-axis represents interbeat interval length in milliseconds, and the Y-axis represents the number of intervals of identical length (Yilmaz et al., 2018). At least a 5-minute sample is required (Shaffer & Ginsberg, 2017). Graphic retrieved from vippng.com.
HRV Myths
Misconception: Short-term and 24-hour measurements are interchangeable.
You cannot interpret short-term metrics using 24-hour norms because they were obtained under different conditions. Briefer recording periods generally underestimate HRV.
Misconception: We can interpret 5-minute slow-paced breathing measurements using 5-minute resting norms.
A resting condition means that participants breathe at typical rates (e.g., 12-14 bpm). You cannot compare its values with resting norms since slow-paced breathing is less than half that rate and increases RSA.
Misconception: We can use UST and short-term measurements interchangeably.
UST measurements are more vulnerable to corruption by artifact because they are based on fewer data points. Currently, there is no consensus on acceptable UST-measurement length. "UST measurements are proxies of proxies. They seek to replace short-term values, which, in turn, attempt to estimate reference standard long-term metrics" (Shaffer, Meehan, & Zerr, 2020).

A clinician calculates an SDNN value of 60 milliseconds from a 15-minute resting baseline and is concerned that his client may have an elevated heart attack risk. What has he overlooked?
He has mistakenly applied cutoffs based on 24-hour recordings to brief recordings. Twenty-four-hour and brief recording values are not interchangeable since short monitoring periods exclude long-term sources of HRV like circadian rhythms.
Glossary
heart rate: the number of heartbeats per minute, also called stroke rate.
heart rate variability (HRV): the beat-to-beat changes in HR involving changes in the RR intervals between consecutive heartbeats.
HR Max – HR Min: an HRV index that calculates the average difference between the highest and lowest HRs during each respiratory cycle.
HRV triangular index (HTI): a geometric measure based on 24-hour recordings, which calculates the integral of the RR interval histogram's density divided by its height.
interbeat interval (IBI): the time interval between the peaks of successive R-spikes (initial upward deflections in the QRS complex).
NN50: the number of adjacent NN intervals that differ from each other by more than 50 milliseconds.
NN interval: the normal-to-normal interval is an IBI after artifacts have been removed.
pNN50: the percentage of adjacent NN intervals that differ from each other by more than 50 milliseconds.
RMSSD: the square root of the mean squared difference of adjacent NN intervals.
SDANN: the standard deviation of the average NN intervals (mean heart rate) for each of the 5-minute segments during a 24-hour recording.
SDNN: the standard deviation of the normal (NN) sinus-initiated IBI measured in milliseconds.
SDNN index (SDNNI): the mean of the standard deviations of all the NN intervals for each 5-minute segment of a 24-hour HRV recording.
SDRR: the standard deviation of the interbeat interval for all sinus beats measured in milliseconds, which predicts both morbidity and mortality.
triangular Interpolation of the NN Interval Histogram (TINN): the baseline width of a histogram displaying NN intervals.
REVIEW FLASHCARDS ON QUIZLET
Click on the Quizlet logo to review our chapter flashcards.
Assignment
Now that you have completed this module, identify the index that is the "gold standard" for predicting the risk of morbidity and mortality when based on 24-hour recording. Which index should be most easily understood by your clients? Why?
References
Andreassi, J. L. (2000). Psychophysiology: Human behavior and physiological response. Lawrence Erlbaum and Associates, Inc.
Berntson, G. G., Quigley, K. S., & Lozano, D. (2007). Cardiovascular psychophysiology. In J. T. Cacioppo, L. G. Tassinary, & G. G. Berntson (Eds.). Handbook of psychophysiology (3rd ed.). Cambridge University Press.
Billman, G. E., Schwartz, P. J., & Stone, H. L. (1982). Baroreceptor reflex control of heart rate: A predictor of sudden cardiac death. Circulation, 66(4), 874-80. https://doi.org/10.1161/01.cir.66.4.874
Booiman, A. (2017). Personal communication regarding HR Max-HR Min slow-paced breathing in the Netherlands.
Burr, R. L., Motzer, S. A., Chen, W., Cowan, M. J., Shulman, R. J., & Heitkemper, M. M. (2006). Heart rate variability and 24-hour minimum heart rate. Biol Res Nurs, 7(4), 256-267. https://doi.org/10.1177/1099800405285268
Ciccone, A. B., Siedlik, J. A., Wecht, J. M., Deckert, J. A., Nguyen, N. D., & Weir, J. P. (2017). Reminder: RMSSD and SD1 are identical heart rate variability metrics. Muscle Nerve. https://doi.org/10.1002/mus.25573
Combatalade, D. (2010). Basics of heart rate variability applied to psychophysiology. Thought Technology Ltd.
DeGiorgio, C. M., Miller, P., Meymandi, S., Chin, A., Epps, J., Gordon, S., Gornbein, J., & Harper, R. M. (2010). RMSSD, a measure of vagus-mediated heart rate variability, is associated with risk factors for SUDEP: The SUDEP-7 Inventory. Epilepsy Behav, 19(1), 78-81. https://doi.org/10.1016/j.yebeh.2010.06.011
Gevirtz, R. N. (2017). Cardio-respiratory psychophysiology: Gateway to mind-body medicine.
Hämmerle, P., Eick, C., Blum, S., Schlageter, V., Bauer, A., Rizas, K. D., . . . Swiss‐AF Study Investigators (2020). Heart rate variability triangular index as a predictor of cardiovascular mortality in patients with atrial fibrillation. Journal of the American Heart Association, 9(15). https://doi.org/10.1161/JAHA.120.016075
Hill, L. K., & Siebenbrock, A. Are all measures created equal? Heart rate variability and respiration – biomed 2009. Biomed Sci Instrum, 45, 71-76. PMID: 19369742
Jarczok, M. N., Koenig, J., & Thayer, J. F. (2021). Lower values of a novel index of vagal-neuroimmunomodulation are associated to higher all-cause mortality in two large general population samples with 18 year follow up. Sci Rep, 11, 2554. https://doi.org/10.1038/s41598-021-82168-6
Jovic, A., & Bogunovic, N. (2011). Electrocardiogram analysis using a combination of statistical, geometric, and nonlinear heart rate variability features. Artificial Intelligence in Medicine, 51, 175-186. https://doi.org/10.1016/j.artmed.2010.09.005
Kleiger, R. E., Miller, J. P., Bigger, J. T., & Moss, A. J. (1987). Decreased heart rate variability and its association with increased mortality after acute myocardial infarction. American Journal of Cardiology, 59, 256-262. https://doi.org/10.1016/0002-9149(87)90795-8
Lehrer, P. M. (2007). Biofeedback training to increase heart rate variability. In P. M. Lehrer, R. M. Woolfolk, & W. E. Sime (Eds.). Principles and practice of stress management (3rd ed.). The Guilford Press.
Lehrer, P. M. (2012). Personal communication.
Lehrer, P. M., Vaschillo, E., & Vaschillo, B. (2000). Resonant frequency biofeedback training to increase cardiac variability: Rationale and manual for training. Applied Psychophysiology and Biofeedback, 25(3), 177-191. https://doi.org/10.1023/a:1009554825745
Nunan, D., Sandercock, G. R. H., & Brodie, D. A. (2010). A quantitative systematic review of normal values for short-term heart rate variability in healthy adults. Pacing and Clinical Electrophysiology, 33(11), 1407-1417. https://doi.org/10.1111/j.1540-8159.2010.02841.x
Pentillä, J., Helminen, A., Jarti, T., Kuusela, T., Huikuri, H. V., Tulppo, M. P., . . . Scheinin, H. (2001). Time domain, geometrical and frequency domain analysis of cardiac vagal outflow: effects of various respiratory patterns. Clin Phys, 21, 365–376. https://doi.org/10.1046/j.1365-2281.2001.00337.x
Schipke, J. D., Arnold, G., and Pelzer, M. (1999). Effect of respiration rate on short-term heart rate variability. J. Clin Basic Cardiol. 2, 92–95.
Schwartz, P. J., Vanoil, E., Stramba-Badiale, M., De Ferrarie, G. M., Billman, G. E., & Foreman, R. D. (1988). Autonomic mechanisms and sudden death. New insights from analysis of baroreceptor reflexes in conscious dogs with and without a myocardial infarction. Circulation, 78(4), 969-79. https://doi.org/10.1161/01.cir.78.4.969
Shaffer, F., & Ginsberg, J. P. (2017). An overview of heart rate variability metrics and norms. Frontiers in Public Health. https://doi.org/10.3389/fpubh.2017.00258
Shaffer, F., McCraty, R., & Zerr, C. L. (2014). A healthy heart is not a metronome: An integrative review of the heart’s anatomy and heart rate variability. Frontiers in Psychology. doi:10.3389/fpsyg.2014.01040
Shaffer, F., Meehan, Z. M., & Zerr, C. L. (2020). Frontiers in Neuroscience. A critical review of ultra-short-term heart rate variability norms research. https://doi.org/10.3389/fnins.2020.594880
Task Force of the European Society of Cardiology and the North American Society of Pacing and Electrophysiology (1996). Heart rate variability: Standards of measurement, physiological interpretation, and clinical use. Circulation, 93, 1043-1065. PMID: 8598068
Tarvainen, M. P., & Niskanen, J.-P. (2017). Kubios HRV version 3.0 user's guide. University of Finland.
Umetani, K., Singer, D. H., McCraty, R., & Atkinson, M. (1998). Twenty-four hour time domain heart rate variability and heart rate: Relations to age and gender over nine decades. Journal of the American College of Cardiology, 31(2), 593-601. https://doi.org/10.1016/s0735-1097(97)00554-8
Zerr, C., Kane, A., Vodopest, T., Allen, J., Fluty, E., Gregory, J., . . ., & Shaffer, F. (2014). Heart rate variability norms for healthy undergraduates [Abstract]. Applied Psychophysiology and Biofeedback, 39(3), 300. https://doi.org/10.1007/s10484-014-9254-9
C. HRV FREQUENCY-DOMAIN MEASUREMENTS
HRV frequency-domain measurements reveal the sources of physiological changes and play an integral role in heart rate variability biofeedback (HRVB).
We train clients to increase LF power in the clinic to enhance vagal tone and HF power when they breathe at typical rates in everyday life (Gevirtz, 2020).
Listen to a mini-lecture on HRV Frequency-Domain Metrics © BioSource Software LLC.
Where time-domain indices quantify the total amount of heart rate variability (HRV), frequency-domain measurements quantify absolute or relative power distribution into four frequency bands.
Analogous to the electroencephalogram (EEG), we can use power spectral analysis or autoregressive (AR) modeling to separate HRV into its component rhythms. Each rhythm operates within a different frequency range. This is analogous to a prism that refracts light into its component wavelengths. Graphic © kmls/Shutterstock.com.

Review this post to learn more about Fast Fourier power spectral analysis.
The Task Force of the European Society of Cardiology and the North American Society of Pacing and Electrophysiology (1996) divided heart rate oscillations into four frequency bands. The VLF, LF, and HF bands are shown below.
This section covers the ULF, VLF, LF, and HF Bands, minimum recording periods, and the controversial LF/HF ratio.
Perspective on Frequency-Domain Measurements
The processes that contribute to HRV operate at different speeds and therefore generate different frequencies. Frequency-domain measurements quantify the absolute or relative amount of HRV signal power within each of four frequency bands (ultra-low, very-low-frequency, low-frequency, and high-frequency).
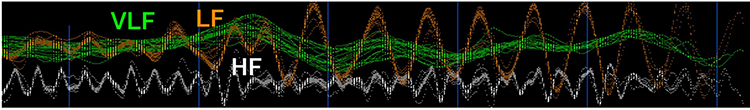
In the graphic below that is courtesy of Dick Gevirtz, very-low-frequency activity is green, low-frequency activity is orange, and high-frequency activity is white.
We express absolute power in ms squared divided by cycles per second (ms2/Hz). Relative power is a frequency band’s percentage of total HRV power. We can express this in normal units (nu) by dividing the absolute power for a specific frequency band by the summed absolute power of the low-frequency (LF) and high-frequency (HF) bands.
While normal units allow us to compare the spectral distribution in two clients directly, they conceal the actual contributions of each frequency band to HRV (Gevirtz, 2020). Journals now prefer the natural logs of LF and HF power. A natural log expresses a value to the base e. The irrational mathematical constant e ≈ 2.71828.
The autonomic contribution to the ultra-low-frequency (ULF), very-low-frequency (VLF), and low-frequency (LF) bands remains controversial since measurements profoundly vary with testing conditions (Lehrer, 2012).
Ultra-Low-Frequency Band
The ultra-low-frequency (ULF) band (≤ 0.003 Hz) indexes fluctuations in interbeat intervals with a period from 5 minutes to 24 hours and is measured using 24-hour recordings (Kleiger et al., 2005). Due to its long cycle length (> 5 hours), ULF activity is too gradual to train using conventional biofeedback (Stauss, 2003).
ULF Sources
There is no consensus regarding the mechanisms that generate ULF power. Very slow-acting biological processes are implicated. Circadian rhythms may be the primary driver of this rhythm (Shaffer, McCraty, & Zerr, 2014). Core body temperature, metabolism, and the renin-angiotensin system operate over a long period and may also contribute to these frequencies (Task Force, 1996; Bonaduce et al., 1994). Different psychiatric disorders show distinct circadian patterns in 24-hour heart rates, particularly during sleep (Stampfer, 1998; Stampfer & Dimmitt, 2013). There is disagreement about the contribution of the PNS and SNS to this band. Due to its long cycle length (> 5 hours), ULF activity is too gradual to train using conventional biofeedback (Stauss, 2003).ULF Correlates
ULF power is highly correlated with the SDANN time-domain index (Bigger et al., 1992).Very-Low-Frequency Band
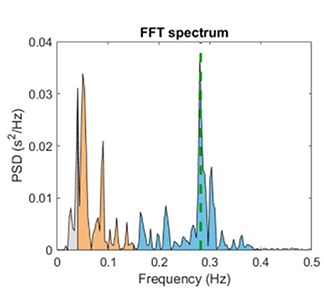
The very-low-frequency (VLF) band (0.0033-0.04 Hz) comprises rhythms with periods between 25 and 300 seconds. VLF measurement requires a recording period of at least 5 minutes but may be best monitored over 24 hours (Task Force, 1996). In the FFT spectral plot, VLF power is colored gray.
VLF Sources
There is uncertainty regarding the physiological mechanisms responsible for activity within this band (Kleiger et al., 2005). The heart's intrinsic nervous system appears to contribute to the VLF rhythm, and the SNS influences the amplitude and frequency of its oscillations (Shaffer, McCraty, & Zerr, 2014).VLF power may also be generated by physical activity (Bernardi et al., 1996), thermoregulatory, renin-angiotensin, and endothelial influences on the heart (Akselrod et al., 1981; Claydon & Krassioukov, 2008). There may be an alpha-adrenergic (norepinephrine-mediated) vascular tone contribution (Lehrer & Gevirtz, 2021). PNS activity may contribute to VLF power since parasympathetic blockade almost completely abolishes it (Taylor et al., 1998). In contrast, sympathetic blockade does not affect VLF power, and VLF activity is seen in tetraplegics, whose SNS innervation of the heart and lungs is disrupted (Task Force, 1996; Berntson et al., 1997).
Based on work by Armour (2003) and Kember et al. (2000, 2001), the VLF rhythm appears to be generated by the stimulation of afferent sensory neurons in the heart. This, in turn, activates various levels of the feedback and feed-forward loops in the heart's intrinsic cardiac nervous system, as well as between the heart, the extrinsic cardiac ganglia, and the spinal column.
Dr. Lehrer explains the VLF band © Association for Applied Psychophysiology and Biofeedback. You can enlarge the video by clicking on the bracket icon at the bottom right of the screen. When finished, click on the ESC key.
VLF Correlates
While all low values on all 24-hour clinical HRV measurements predict a greater risk of adverse outcomes, VLF power is more strongly associated with all-cause mortality than LF or HF power (Tsuji et al., 1994, 1996; Hadase et al., 2004; Schmidt et al., 2005). The VLF rhythm may be fundamental to health (Shaffer, McCraty, & Zerr, 2014).Low VLF power is associated with arrhythmic death (Bigger et al., 1992) and PTSD (Shah et al., 2013). Low power in this band has been associated with high inflammation in several studies (Carney et al., 2007; Lampert et al., 2008).
Finally, low VLF power has been correlated with low testosterone levels, while other biochemical markers, such as those mediated by the HPA axis (e.g., cortisol), did not (Theorell et al., 2007). VLF power is strongly correlated with the SDNN index time domain measure, which averages 5-minute standard deviations for all NN intervals over 24 hours.
Significance for HRV Biofeedback
VLF elevations may signal chronic SNS activation or vagal withdrawal (parasympathetic suppression) due to chronic worry or excessive effort during training (Gevirtz, 2017).Low-Frequency Band
The low-frequency (LF) band (0.04-0.15 Hz) is comprised of rhythms with periods between 7 and 25 seconds, is affected by breathing from ~3-9 breaths per minute (bpm), and requires a recording period of at least 2 minutes (Task Force, 1996). The baroreflex system’s resonance falls within the LF band. This region was previously called the baroreceptor range because it reflects baroreceptor activity during resting conditions (McCraty & Shaffer, 2015). In the FFT spectral plot, LF power is colored orange.
LF Sources
While there is disagreement regarding this band's activity sources, a sympathetic role during resting measurements appears unlikely (Hayano & Yuda, 2019). The PNS and blood pressure regulation may produce LF power via baroreceptors (Akselrod et al., 1981; Berntson, Quigley, & Lozano, 2007; Lehrer, 2007; Task Force, 1996) or by baroreflex activity alone (Goldstein et al., 2011). The late Evgeny Vaschillo studied a possible SNS component near 0.05 Hz (Lehrer & Gevirtz, 2021). Breathing at rates below 8.5 breaths per minute, sighing, and taking deep breaths may contribute to LF activity via the vagus (Shaffer, McCraty, & Zerr, 2014).Dr. Lehrer explains the LF band © Association for Applied Psychophysiology and Biofeedback.
Significance for HRV Biofeedback
Use LF band power to assess the success of HRVB when your client breathes from 4.5-7.5 bpm (Shaffer & Ginsberg, 2017). Expect elevated LF during resonance frequency (RF) breathing. High LF at typical breathing rates (e.g., 12-14 bpm) signals that the vagal brake is malfunctioning (Khazan, 2020).A single high amplitude peak near 0.1 Hz indicates high coherence within the Institute of HeartMath model.
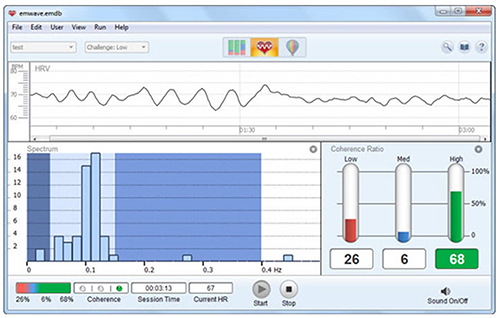
Caption: The Institute of HeartMath display shows instantaneous HR at the top. The bottom left features a HRV spectral display. Note that there are two peaks around 0.1 Hz instead of one. The bottom right shows coherence ratios. Note that the individual has only achieved 68% high coherence at the low challenge level.
Coherence is a proprietary HeartMath term that means a "narrow, high-amplitude, easily visualized peak" from 0.09-0.14 Hz (Ginsberg, Berry, & Power, 2010, p. 54).High-Frequency (HF) Band
The high-frequency (HF) or respiratory band (0.15-0.40 Hz) is influenced by breathing from 9-24 bpm (Malik, 1996) and requires a recording period of at least 1 minute. For infants and children, who breathe faster than adults, the resting range can be adjusted to 0.24-1.04 Hz (Quintana et al., 2016).
HF Sources
The HF band reflects parasympathetic activity and is called the respiratory band because it corresponds to the HR variations related to the respiratory cycle. These phasic HR changes are known as respiratory sinus arrhythmia (RSA) and may not be a pure index of cardiac vagal control (Grossman & Taylor, 2007).Recall that HR accelerates during inspiration and slows during expiration. During inhalation, the cardiovascular center inhibits vagal outflow, speeding the heart rate. Conversely, during exhalation, it restores vagal tone, slowing the heart rate via the release of acetylcholine (Eckberg & Eckberg, 1982).
Total vagal blockage virtually eliminates HF oscillations and reduces power in the LF range (Shaffer, McCraty, & Zerr, 2014).
Dr. Lehrer explains the HF band © Association for Applied Psychophysiology and Biofeedback.
HF Correlates
HF power is highly correlated with the pNN50 and RMSSD time-domain measures (Kleiger et al., 2005). HF band power may increase at night and decrease during the day (McCraty & Shaffer, 2015). Lower HF power is correlated with stress, panic, anxiety, or worry. The modulation of vagal tone helps maintain the dynamic autonomic regulation important for cardiovascular health. Deficient vagal inhibition is implicated in increased morbidity (Thayer et al., 2010).Significance for HRV Biofeedback
Use HF band power and time-domain metrics like RMSSD to assess HRV biofeedback training success during resting baselines (Shaffer & Ginsberg, 2017).HRVB trains clients to increase LF power during slow-paced breathing to increase HF power during baselines when they breathe at typical rates.
The graphic below shows HF power in blue during a pre-training baseline, HRVB training, and a post-training baseline. Note the greater LF power concentration post-training compared with pre-training during which the client breathed at typical rates. Inna Khazan generously provided the spectral plots.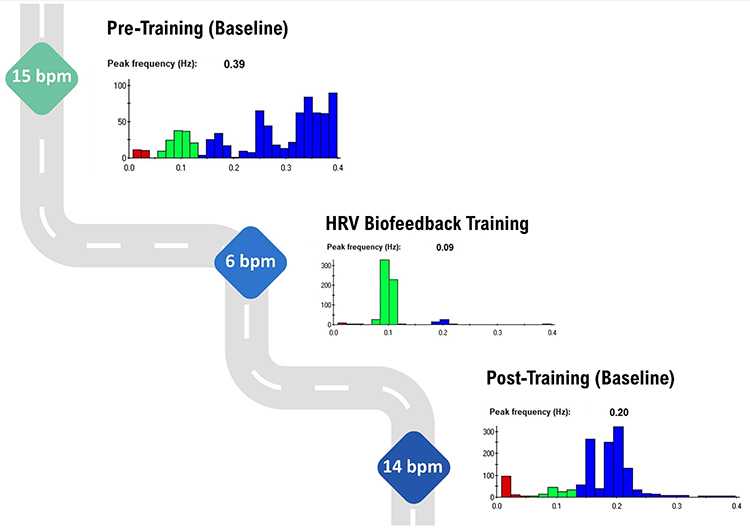
LF/HF Ratio
Power is the signal energy contained within a given frequency band. The ratio of LF to HF power is called the LF/HF ratio. This ratio was based initially on 24-hour recordings, during which both PNS and SNS activity contribute to LF power, although PNS activity primarily contributes to HF power. The intent was to estimate the ratio between SNS and PNS activity.
Calculation of an LF/HF ratio from brief or resting recordings is controversial because short-term measurements are poorly correlated with 24-hour values. Moreover, the SNS contribution to LF activity varies profoundly with testing conditions (Lehrer, 2012). For example, when LF is calculated during resting conditions, the primary contributors are PNS activity and baroreflex activity--not SNS activity. Therefore, a 5-minute resting baseline cannot estimate autonomic balance (McCraty, 2013).
MINIMUM RECORDING PERIODS FOR FREQUENCY-DOMAIN MEASURES
The table below shows conventional and ultra-short-term samples (in parentheses) for the four HRV bands (Shaffer, Meehan, & Zerr, 2020).
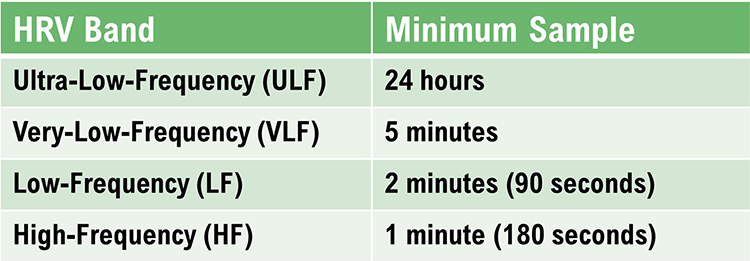
HF Power and RSA Do Not Represent Vagal Tone
In healthy individuals, RSA can be increased by slow, deep breathing. Respiration rate changes can produce large-scale shifts in RSA magnitude without affecting vagal tone, which is mean HR change across conditions (e.g., rest to exercise) (Grossman, 2017b).
Grossman (2017a) proposed an experiment. If you slow your breathing to 6 bpm, you should observe increased HR fluctuations compared with 15 bpm. During this time, mean HR should not appreciably change because vagal tone did not decrease.
While HF power indexes vagal modulation of HR, it does NOT represent vagal tone. If shifts in HF power mirrored shifts in vagal tone, they should produce corresponding changes in average HR. But, breathing at different rates within the 9-24-bpm range, which changes HF power, does not change mean HR.
RSA and vagal tone are dissociated during large-scale changes in SNS activity, chemical blockade of the SA node, and when intense vagal efferent traffic dramatically slows HR during inhalation and exhalation (Grossman & Taylor, 2007).
Shifts in respiration rate and volume can markedly change HRV indices of cardiac vagal tone (HF power, peak-to-trough differences, pNN50, RMSSD) without affecting vagal tone.
LnHF Power Can Estimate Vagal Tone Under Controlled Conditions
The natural logarithm (Ln) is the logarithm to the base e of a numeric value. Under controlled conditions while breathing at normal rates, we can use LnHF power to estimate vagal tone (Gevirtz, 2017).
Baroreflex sensitivity is strongly associated with power in the high-frequency band.
In the Kubios table below, HF power of 910.67 corresponds to LnHF of 6.81.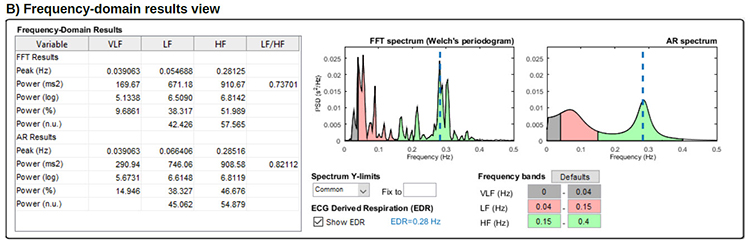
Dr. Lehrer explains HF band power and vagus nerve function © Association for Applied Psychophysiology and Biofeedback.
Summary Tables
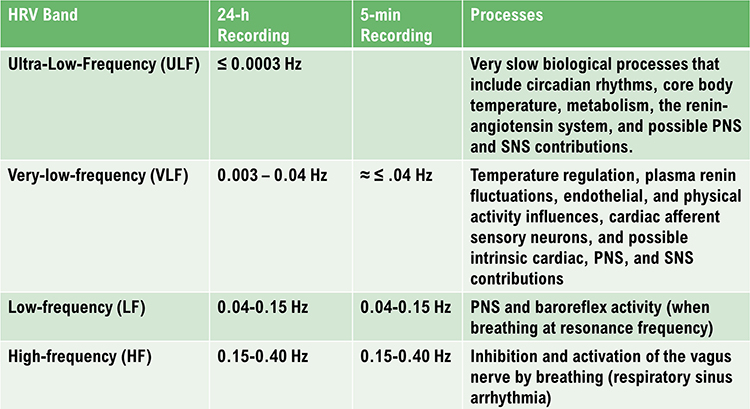
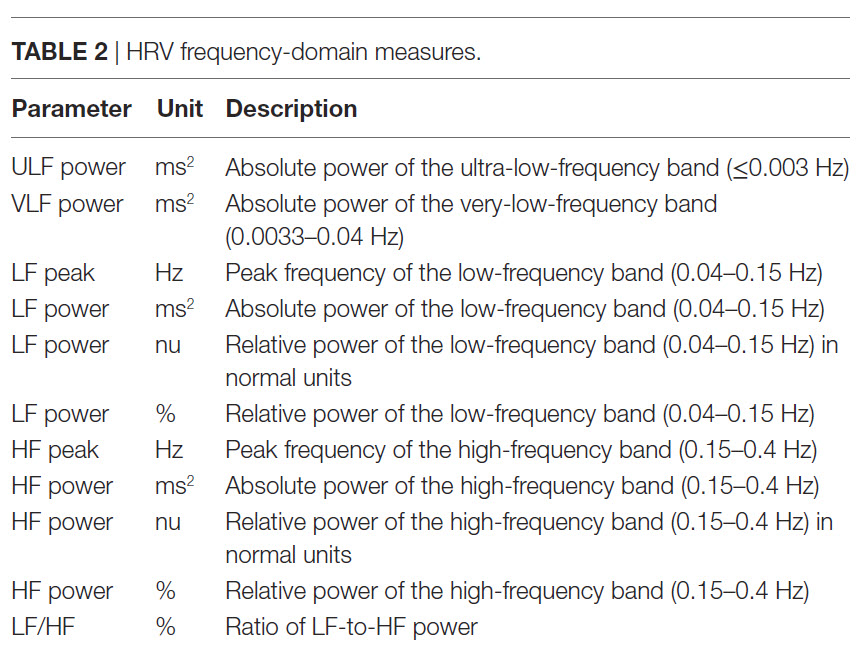
HRV Myths
Misconception: HF and VLF measurements are valid during slow-paced breathing.
HF and VLF values are meaningless during slow-paced breathing near the RF.
Misconception: The SNS contributes to LF power.
During resting baseline conditions, the SNS does not generate LF power. PNS activity and the baroreceptor reflex are the two primary LF sources.
Misconception: The LF/HF ratio estimates autonomic balance during short-term baseline measurements.
Since the SNS does not contribute significantly to LF power under these conditions, the LF/HF ratio does not measure autonomic balance.
Glossary
absolute power: the magnitude of HRV within a frequency band measured in milliseconds squared divided by cycles per second (ms2/Hz).
coherence: self-coherence; signal power in the 0.09-0.14 region of the LF band.
heart rate: the number of heartbeats per minute, also called stroke rate.
heart rate variability (HRV): the beat-to-beat changes in heart rate, including changes in the RR intervals between consecutive heartbeats.
high-frequency (HF) band: a HRV frequency range from 0.15-0.40 Hz that represents the inhibition and activation of the vagus nerve by breathing (respiratory sinus arrhythmia).
interbeat interval (IBI): the time interval between the peaks of successive R-spikes (initial upward deflections in the QRS complex). This is also called the NN (normal-to-normal) interval.
low-frequency (LF) band: a HRV frequency range of 0.04-0.15 Hz that may represent the influence of PNS and baroreflex activity (when breathing at the RF).
natural logarithm (Ln): the logarithm to the base e of a numeric value.
normal units (nu): the division of the absolute power for a specific frequency band by the summed absolute power of the low frequency (LF) and high frequency (HF) bands.
power: the signal energy found within a frequency band.
relative power: the percentage of total HRV.
spectral analysis: the division of heart rate variability into its component rhythms that operate within different frequency bands.
total power: the sum of power (ms2) in the ULF, VLF, LF, and HF bands for 24-hour recording and the VLF, LF, and HF bands for brief recording.
ultra-low-frequency (ULF) band: a HRV frequency range below 0.003 Hz. Very slow biological processes that include circadian rhythms, core body temperature, metabolism, the renin-angiotensin system, and possible PNS and SNS contributions.
very-low-frequency (VLF): a HRV frequency range of 0.003-0.04 Hz that may represent temperature regulation, plasma renin fluctuations, endothelial, and physical activity influences, and possible intrinsic cardiac, PNS, and SNS contributions.
REVIEW FLASHCARDS ON QUIZLET
Click on the Quizlet logo to review our chapter flashcards.
Assignment
Now that you have completed this module, explain why we cannot provide immediate ULF feedback. Why is increasing LF power desirable?
References
Andreassi, J. L. (2000). Psychophysiology: Human behavior and physiological response. Lawrence Erlbaum and Associates, Inc.
Armour, J. A. (2003). Neurocardiology: Anatomical and functional principles. Institute of HeartMath.
Berntson, G. G., Quigley, K. S., & Lozano, D. (2007). Cardiovascular psychophysiology. In J. T. Cacioppo, L. G. Tassinary, & G. G. Berntson (Eds.). Handbook of psychophysiology (3rd ed.). Cambridge University Press.
Claydon, V. E., & Krassioukov, A. V. (2008). Clinical correlates of frequency analyses of cardiovascular control after spinal cord injury. American Journal of Physiology—Heart and Circulatory Physiology, 294(2), H668-H678. https://doi.org/10.1152/ajpheart.00869.2007
Combatalade, D. (2010). Basics of heart rate variability applied to psychophysiology. Thought Technology Ltd.
Gevirtz, R. N. (2017). Cardio-respiratory psychophysiology: Gateway to mind-body medicine.
Gevirtz, R. N. (2020). The myths and misconceptions of heart rate variability. Association for Applied Psychophysiology and Biofeedback Virtual Conference.
Goldstein, D. S., Bentho, O., Park, M. Y., & Sharabi, Y. (2011). Low frequency power of heart rate variability is not a measure of cardiac sympathetic tone but may be a measure of modulation of cardiac autonomic outflows by baroreflexes. Exp Physiol, 96(12), 1255-1261. https://doi.org/10.1113/expphysiol.2010.056259
Grossman, P. (2017a and 2017b). Comments on Heart rate variability and cardiac vagal tone in psychophysiological research. Frontiers in Psychology.
Grossman, P., & Taylor, E. W. (2007). Toward understanding respiratory sinus arrhythmia: Relations to cardiac vagal tone, evolution and biobehavioral functions. Biological Psychology, 74, 263-285. https://doi.org/10.1016/j.biopsycho.2005.11.014
Khazan, I. (2020). The myths and misconceptions of heart rate variability. Association for Applied Psychophysiology and Biofeedback Virtual Conference.
Lehrer, P. M. (2007). Biofeedback training to increase heart rate variability. In P. M. Lehrer, R. M. Woolfolk, & W. E. Sime (Eds.). Principles and practice of stress management (3rd ed.). The Guilford Press.
Lehrer, P. M. (2012). Personal communication about the sources of frequency domain measurements.
Lehrer, P. M., & Gevirtz, R. (2021). BCIA HRV Biofeedback didactic workshop. Association for Applied Psychophysiology and Biofeedback.
Lehrer, P. M., Vaschillo, E., & Vaschillo, B. (2000). Resonant frequency biofeedback training to increase cardiac variability: Rationale and manual for training. Applied Psychophysiology and Biofeedback, 25(3), 177-191. https://doi.org/10.1023/a:1009554825745
McCraty, R. (2013). Personal communication regarding the LF/HF ratio.
Moss, D. (2004). Heart rate variability (HRV) biofeedback. Psychophysiology Today, 1, 4-11.
Nunan, D., Sandercock, G. R. H., & Brodie, D. A. (2010). A quantitative systematic review of normal values for short-term heart rate variability in healthy adults. Pacing and Clinical Electrophysiology, 33(11), 1407-1417. https://doi.org/10.1111/j.1540-8159.2010.02841.x
Task Force of the European Society of Cardiology and the North American Society of Pacing and Electrophysiology (1996). Heart rate variability: Standards of measurement, physiological interpretation, and clinical use. Circulation, 93, 1043-1065. PMID: 8598068
Tarvainen, M. P., & Niskanen, J.-P. (2020). Kubios HRV version 3.4 user's guide. University of Finland.
Theorell, T., Liljeholm-Johansson, Y., Björk, H., & Ericson, M. (2007). Saliva testosterone and heart rate variability in the professional symphony orchestra after “public faintings” of an orchestra member. Psychoneuroendocrinology, 32, 660–668. https://doi.org/10.1016/j.psyneuen.2007.04.006
D. HRV ASSESSMENT
Clinicians can measure the interbeat interval (IBI) using electrocardiography (ECG) to find the R-spike and photoplethysmography (PPG) to find the peak of the blood volume pulse (BVP) signal. The R-spike is volume conducted by the heart, while the pulse wave travels down the arterial tree to an earlobe or finger.
The ECG method calculates heart rate variability (HRV), while the PPG approach measures pulse rate variability (PRV). Clinicians and consumers use PRV to estimate HRV parameters like RMSSD.
Short-term ECG and PPG IBI measurements are highly correlated at rest. However, this relationship breaks down when clients engage in paced breathing (PB) or standing. HRV and PRV metrics also diverge when clients move or are challenged by stressors because sympathetic nervous system (SNS) activation changes the stiffness of the blood vessels and reduces pulse transit time (the time it takes for the blood pressure wave to travel through the arteries).
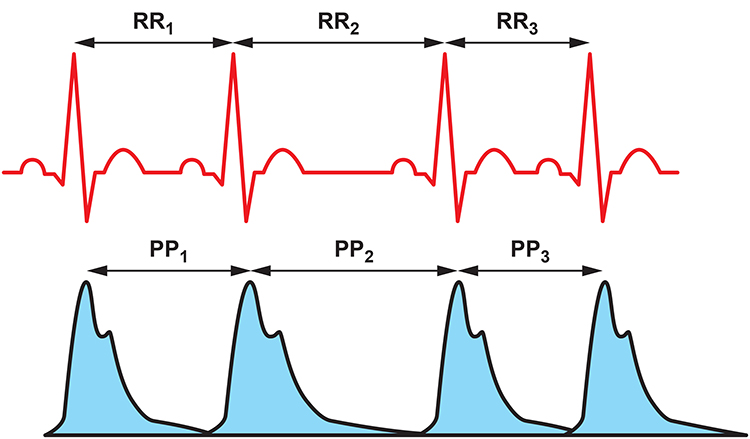
Although 24-hour recordings remain the "gold standard" for health risk stratification, there is growing evidence that brief measurements (e.g., 5-minute) can predict mortality. Bittium Faros™ 360 ambulatory ECG.
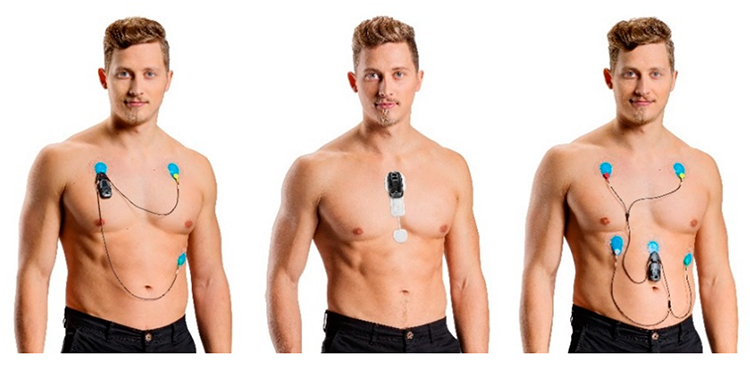
Clinicians should consider context and client characteristics when interpreting HRV time- and frequency-domain measurements. Both sets of HRV metrics must be referenced to age- and gender-related norms for the appropriate monitoring period.
We cannot compare HRV time-domain values (e.g., RMSSD and SDNN) obtained during slow-paced breathing to resting norms. Moreover, very-low-frequency and high-frequency measurements are meaningless during slow-paced breathing.
This section covers Brief Versus 24-Hour Monitoring, The Validity of Ultra-Short-Term Measurements, 24-Hour Monitoring Captures Slower Rhythms, How To Interpret HRV Measurements, HRV Time-Domain, and Frequency-Domain Norms,
Brief Versus 24-hour Monitoring
HRV time-domain measures quantify the degree of variability in the interbeat intervals (IBIs) between adjacent heartbeats observed during monitoring periods that may range from 60 seconds to 24 hours (Shaffer, McCraty, & Zerr, 2014). Brief resting measurement periods underestimate time-domain values. Nunan et al. (2010) found that published brief values for healthy adults were lower than Task Force (1996) norms.
HRV frequency-domain measures use power spectral analysis to separate HRV into its component frequency bands, including ultra-low-frequency (ULF), very-low-frequency (VLF), low-frequency (LF), and high-frequency (HF). Brief monitoring cannot accurately measure ULF power since processes generate it with periods that range from 5 minutes to 24 hours. These oscillations are so gradual that clinicians cannot provide real-time ULF biofeedback. Likewise, slow fluctuations contribute to VLF activity, so brief monitoring periods produce values of questionable validity.
The Validity of Ultra-Short-Term Measurements
The explosion in ambulatory heart rate monitoring has increased interest in ultra-short-term (UST) HRV measurements based on less than 5 minutes of data. The Fitbit Sense is shown below.
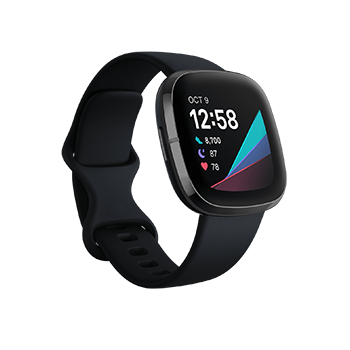
Evaluate HRV UST Studies with Caution
The HRV UST literature is in its infancy. UST studies compare samples as brief as 10 seconds with conventional 5-minute samples to evaluate their equivalence. Several studies have made the mistake of assuming that the correlation between two measurements denotes agreement. Correlation doesn't imply equality since it does not control measurement bias (Bland & Altman, 1986). Eight of eleven studies reviewed by Shaffer, Meehan, and Zerr (2020) did not address measurement bias, rendering their findingsBest Statistical Practices
Researchers should determine a priori the largest acceptable difference between an UST and 300-second HRV value. Next, they should prepare difference plots like Bland–Altman using a 95% confidence interval and conduct an equality test (e.g., Student’s t-test) to confirm that the UST and 300-second values are identical. When an UST measurement passes the quality test, it is a surrogate (Shaffer, Meehan, & Zerr, 2020).Summary of HRV UST Studies
McNames and Aboy (2006) compared 10-second to 10-minute resting ECG recordings with 5-minute recordings using archival data from PhysioNet. HF, the standard deviation of successive NN interval differences (SDSD), and RMSSD achieved the strongest correlations. Fleming and DeMets (1996) observed, "A correlate does not a surrogate make" (p. 605).Salahuddin et al. (2007) obtained 5 minutes of resting ECG data from 24 healthy students. Mean heart rate and RMSSD required 10 seconds, PNN50, HF, LF/HF, LFnu, and HFnu required 20 seconds, LF required 30 seconds, VLF required 50 seconds, SDNN and the coefficient of variance (CV) needed 60 seconds, HRV Index and TINN required 90 seconds, and the Stress Index (SI) required 100 seconds, to estimate 150-second values.
Nussinovitch et al. (2011) compared 10-second and 1-minute resting ECG recordings with 5-minute recordings from 70 healthy volunteers. While ultra-short-term RMSSD measurements achieved acceptable correlations, SDNN did not.
Esco and Flatt (2014) acquired ECG measurements from 23 male collegiate athletes (aged 19–21 years) for 10 minutes while supine before a treadmill test and 30 minutes post-exercise. They analyzed the last 5 minutes of each rest period and compared log-transformed 10-, 30-, and 60-seconds with 300-second root mean square of the successive differences (RMSSD) values. They compared intra-class correlations (ICCs) and Bland–Altman plots (mean difference ± 1.96 SD) across the three UST periods and concluded that 60 seconds yielded the largest ICC and most stringent LOA. Whereas the ICC test identified 60 seconds as a potential surrogate, a Bland–Altman plot confirmed its criterion validity with respect to 300-second RMSSD measurements.
Baek et al. (2015) recorded 5 minutes of resting PPG data from 467 healthy volunteers. Heart rate required 10 seconds, HF required 20 seconds, RMSSD required 30 seconds, pNN50 required 60 seconds, LF, LFnu, HFnu, and LF/HF required 90 seconds, SDNN required 240 seconds, and VLF needed 270 seconds to estimate 5-minute values. These minimum periods differed by age group.
Baek et al. (2015) obtained resting PPG measurements from 467 healthy participants (249 men and 218 women; aged 8–69). They compared 10-, 20-, 30-, 60-, 90-, 180-, 210-, 240-, and 270-second values with 300-second measurements. Their criteria for selecting the shortest UST period were a significant Pearson r and non-significant (p > 0.05) Kruskal–Wallis statistic. Although they illustrated their results with Bland–Altman plots (mean difference ± 1.96 SD), the authors did not use them to draw conclusions.
Munoz et al. (2015) recorded beat-to-beat middle finger pressure using a Portapres® device from 3387 participants (1660 men and 1727 women; aged 44–63 years) in the Prevention of Renal and Vascular End-Stage Disease study. They obtained recordings over 15 minutes while resting in the supine position. The authors analyzed the last 4–5 minutes of data that exhibited a stationarity pattern and compared the log-transformed 10-, 30-, and 120-second with 300-second RMSSD and SDNN values. They compared ICC, Pearson r values, and Bland–Altman plots across the three UST periods. The authors concluded that a minimum of 10 seconds was required to measure RMSSD and 30 seconds to calculate SDNN.
Shaffer et al. (2019) obtained 5-minute EEG recordings from 38 healthy undergraduates (20 men and 18 women; aged 18–23 years) while sitting upright under resting conditions with their eyes open. They acquired 10-, 20-, 30-, 60-, 90-, 120-, 180-, and 240-s epochs from the 5-min recordings. They calculated the time domain, frequency domain, and non-linear HRV metrics following the manual removal of artifacts. The authors identified potential surrogates using a Pearson r with a conservative criterion (r ≥ 0.90). They applied Bland–Altman’s LOA technique using an allowable difference of ±5% of the range of the 5-min value and a Student’s t-test to confirm the equality of UST and ST values. The minimum UST values are shown in the table below.
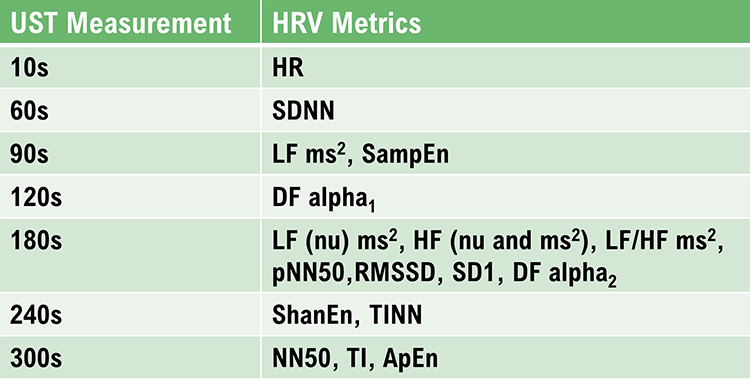
Caption: DFA a1, detrended fluctuation analysis, which describes short-term fluctuations; DFA a2, detrended fluctuation analysis, which describes long-term fluctuations; ECG, electrocardiogram; HF ms2 absolute power of the HF band; HFnu, relative power of the HF band in normal units; HF peak, highest amplitude frequency in the HF band; HF%, HF power as a percentage of total power; HR, heart rate; HTI, HRV triangular index or integral of the density of the NN interval histogram divided by its height; limits of agreement, criterion that two methods are equivalent if there is an acceptable a priori difference between their values in absolute units; LF ms2, absolute power of the LF band; LFnu, relative power of the LFy band in normal units; LF peak, highest amplitude frequency in the LF band; LF%, LF power as a percentage of total power; LF/HF, ratio of LF-to-HF power; NN interval, time between adjacent normal heartbeats; nu, normal units calculated by dividing the absolute power for a specific frequency band by the summed absolute power of the LF and HF bands; pNN50, percentage of successive interbeat intervals that differ by more than 50 ms; RMSSD, root mean square of successive R–R interval differences; R–R interval, time between all adjacent heartbeats; SampEn, sample entropy, which measures signal regularity and complexity; SD1, Poincaré plot standard deviation perpendicular to the line of identity; SD2, Poincaré plot standard deviation along the line of identity; SD1/SD2, ratio of SD1 to SD2 that measures the unpredictability of the R–R time series and autonomic balance under appropriate monitoring conditions; SDNN, standard deviation of NN intervals; TINN, triangular interpolation of the R–R interval histogram or baseline width of the RR interval histogram; total power, sum of power (ms2) in VLF, LF, and HF bands; UST, ultra-short-term (< 5 min).
Perspective
The varying minimum recording periods reported by the reviewed studies may reflect differences in recording method (BVP or ECG), age, health, measurement conditions, artifacting procedures, and the equivalence criteria used. Discount any study that did not specify a minimum acceptable difference a priori and conduct a Bland-Altman difference plot with an equality test.
For healthy individuals, resting baselines as brief as 1 minute should be sufficient to measure heart rate and SDNN, and 3 minutes to measure RMSSD as long as the data are carefully artifacted. Clinicians should not use these measurements instead of conventional 5-minute and 24-hour metrics until measurement protocols are standardized and normative values for healthy nonathlete, optimal performance, and clinical populations are established.
24-Hour Monitoring Detects Slower Rhythms
Twenty-four-hour monitoring detects slower sources of variability and a wider range of activity than brief recording. Circadian rhythms, core body temperature, metabolism, the renin-angiotensin system, and parasympathetic and sympathetic activity may contribute to 24-hour HRV (Shaffer, McCraty, & Zerr, 2014).
Services like the HeartMath Institute's Autonomic Assessment Report ® can artifact and analyze uploaded 24-hour data to provide more comprehensive evaluation than is possible in a clinical setting. The following profile assesses a 51-year-old male at elevated risk for heart attack © Institute of HeartMath.
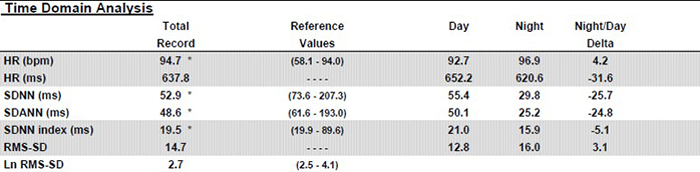
Caption: Note the dramatic difference of almost 26 milliseconds in SDNN between day and night values. Twenty-four-hour monitoring provides a more complete assessment of time-domain measures.
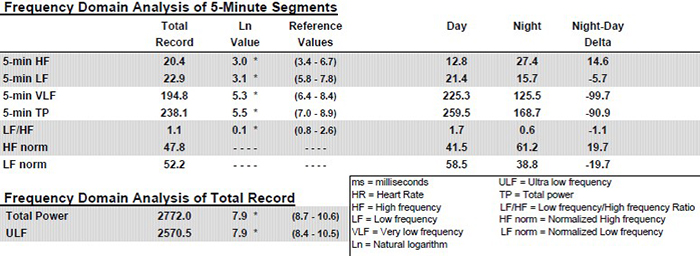
Twenty-four-hour monitoring permits the calculation of ULF power and includes sleep data in calculating the power in all four frequency bands. Again, see the striking differences between day and night values in all the bands. Twenty-four-hour monitoring also provides a more complete assessment of frequency domain measures.
Clinicians should consider supplementing short-term pre- and post-assessment with 24-hour monitoring, particularly for clients with elevated heart attack risk. This model is analogous to the increased administration of a quantitative EEG (qEEG) to guide and evaluate improvement in neurofeedback. Below is a brain map.
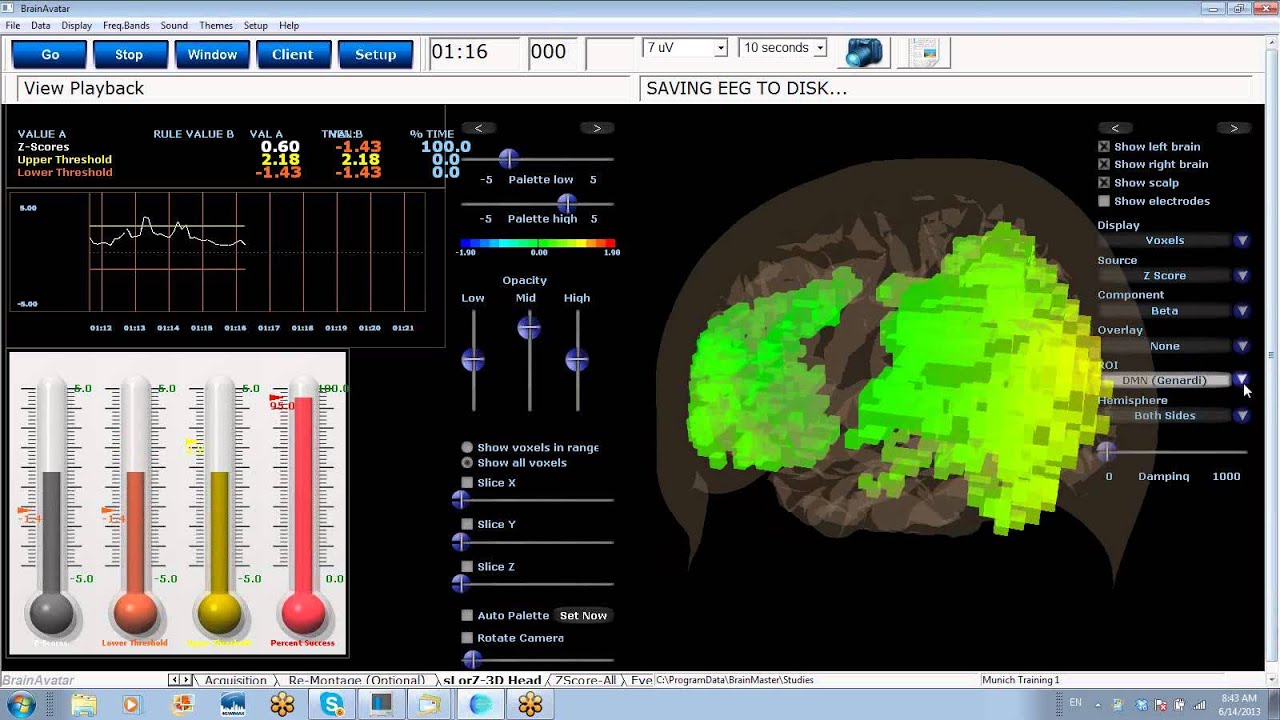
How To Interpret HRV Measurements
Measurement context and client characteristics are crucial to to interpreting HRV time domain and frequency domain measurements.
Measurement Context
Contextual factors include:1. monitoring period length (e.g., brief or 24-hour)
2. detection method
3. presence or absence of feedback and pacing
4. ambulatory or stationary monitoring
5. position (e.g., supine or sitting upright)
6. intensity of physical activity
7. tasks performed during measurement
8. social demand characteristics within the monitoring situation
9. relationship with staff
Recording period length, detection method, feedback, breathing pacing, movement, position, the intensity of physical activity, tasks, demand characteristics, and relationship variables can affect both sets of measurements by changing ANS activation, breathing mechanics, and emotions.
Recording Period Length
The length of the recording period significantly affects both HRV time- and frequency-domain measurements. Resting values obtained from brief monitoring periods may correlate poorly with 24-hour indices.Detection Method
Under resting conditions, ECG and PPG methods yielded errors less than 6% for most HRV measures and 29.9% for pNN50 in one study (Jeyhani et al., 2015). However, the PPG method may inflate HRV values and be a poor surrogate for ECG when participants stand, perform slow-paced breathing, or have low HRV (Constant et al., 1999; Hemon & Phillips, 2016; Jan et al., 2019; Medeiros et al., 2011).Client Characteristics
Client characteristics include:1. age
2. sex
3. health
4. aerobic fitness
5. medication
6. recent or immediate physical activity
7. breathing pattern (e.g., respiration rate and inhalation-to-exhalation ratio)
8. cognitive and emotional activity (e.g., affect, expectancies, imagery, and self-statements)
Age
HRV time-domain measurements decline with age (Nunan et al., 2010; Abhishekh et al., 2013) and decreased health (Agelink, Box, Ullrich, & Andrich, 2002; Bigger et al., 1995).Almedia-Santos et al. (2016) obtained 24-hour ECG recordings of 1743 subjects 40-100 years of age. They found a linear decline in SDNN, SDANN, and SDNN index. However, they found a U-shaped pattern for RMSSD and pNN50 with aging, decreasing from 40-60 and then increasing after age 70.
Bonnemeier et al. (2003) obtained 24-hour recordings from 166 healthy volunteers (85 men and 81 women) ages 20-70. They found the most dramatic HRV parameter decrease between the second and third decades.
Sex
A meta-analysis of 296,247 healthy participants examined 50 HRV measures (Koenig & Thayer, 2016). Women had higher mean HR (smaller RR intervals) and lower SDNN and SDNN index values, especially in 24-hour studies, compared to men. They showed lower total, VLF, and LF power but greater HF power.While women showed relative vagal dominance, despite higher mean HR, men showed relative SNS dominance, despite their lower HR.
Health
Cardiovascular disorders, disorders with autonomic dysregulation (anxiety and depression), and asthma are associated with reduced HRV (Shaffer & Venner, 2013).Aerobic Fitness
Time-domain measurements rise with increased aerobic fitness (Aubert, Seps, & Beckers, 2003; De Meersman, 1993).Medication
Medication can affect both time domain and frequency domain measurements. It is essential to review a list of all the medications your client is currently taking. While caffeine, calcium channel blockers, and SSRIs like Prozac have minimal effect on HRV measurements, drugs like bupropion (Wellbutrin) and tricyclics like Elavil can suppress SDNN.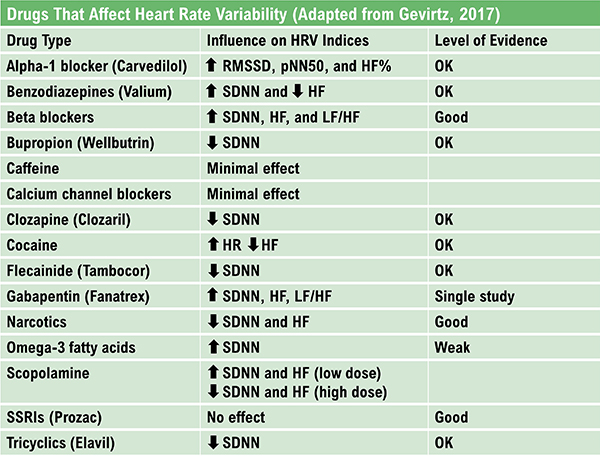
Breathing
Compared with breathing at typical rates, slow-paced breathing can increase time-domain measurements and render frequency-domain calculations meaningless (Gevirtz, 2021; Nunan et al., 2010).Paced breathing in the LF range increases RSA, exercises the baroreflex, and maximizes time-domain and LF band (Shaffer & Meehan, 2020). Breathing at rates significantly above or below an individual's RF may diminish time-domain and LF band values. Overbreathing is often associated with shallow thoracic breathing at rates that are multiples of the RF (Khazan, 2019).
Emotions
HRV measurements are state-dependent. HRV is lowered by stress, difficult emotions (e.g., anger and anxiety), and higher cognitive loads (McCraty, 2012).Sympathetic nervous system activation may increase power in the ULF, VLF, and LF bands, resulting in a high LF/HF ratio (Lehrer, 2012).
HRV Time-Domain and Frequency-Domain Norms
After you have artifacted client HRV data, you may compare these values to appropriate short-term or 24-hour norms. Remember that short-term and 24-hour values are not interchangeable.
Prediction of Mortality
The predictive power of 24-hour recordings to predict mortality is well-established.
Kleiger and colleagues (1987) demonstrated the 24-hour VLF and LF power predicted mortality years after myocardial infarction. Moreover, the Task Force report (1996) stratified heart attack risk using 24-hour SDNN measurements. These norms are reproduced later in this unit.Researchers have also shown that selected brief measures can also predict mortality.
ECG frequency-domain (VLF, LF, HF, and LF/HF) values obtained from 2- to 15-minute recordings predicted death from all causes, myocardial infarction, arrhythmia, and sudden death over a 31-month follow-up (Bigger, Fleiss, & Steinman, 1993).Five-minute ECG HRV triangular index (HTI) recordings predicted cardiovascular and all-cause death in atrial fibrillation patients with a mean follow-up from 1.6 to 3.6 years (Hämmerle et al., 2020).
Compare Apples with Apples
To compare client data to short-term norms, you must use the same participant characteristics (e.g., age, fitness, and sex), recording method (e.g., ECG or PPG), position, tasks, feedback, and breathing rates) to ensure valid conclusions.Brief-Measurement Norms
Nunan et al. (2010) reviewed normative data from short-term HRV studies published after the Task Force report (1996). The 44 selected studies meeting their criteria involved 21,438 healthy adult participants. The authors reported HRV values according to whether breathing was free or paced, sex, and spectral power analysis (autoregression or Fast Fourier transformation).Recall that LFnu and HFnu are normalized values calculated for brief measurements by dividing LF power or HF power by the sum of LF power + HF power.
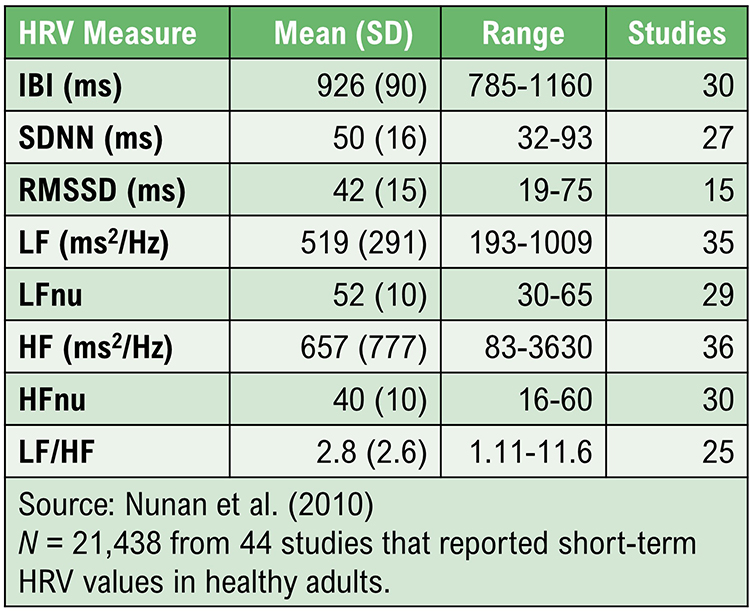
Children 6-8 Years of Age
Seppälä et al. (2014) reported HRV metrics from 1- and 5-minute ECG recordings from 465 children ages 6-8. The table reproduces the 5-minute percentiles for a majority of the parameters.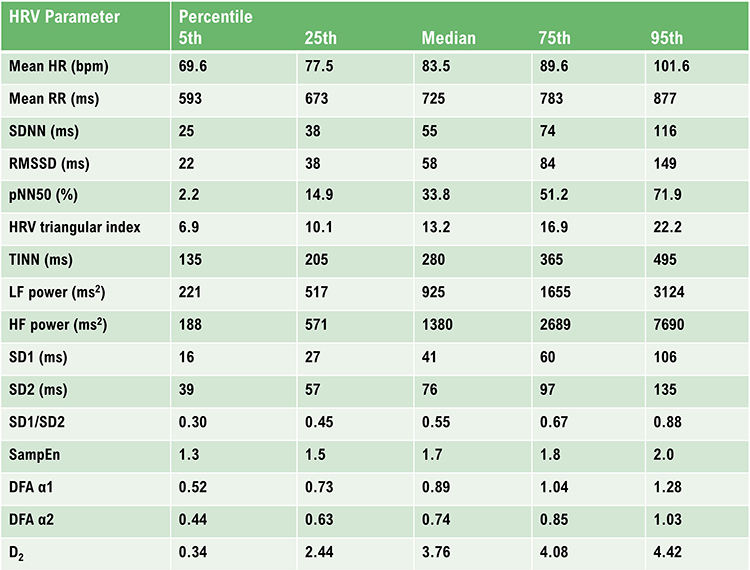
Undergraduate Norms
Urban et al. (2019) reported 5-minute baseline measurements on 85 undergraduates (59 women and 26 men), 18-28 years of age. Participants sat upright with eyes open, no feedback, and with instructions to breathe normally. HRV data were obtained using ECG. Data were detrended using a smoothness priors procedure. The frequency-domain analysis utilized Welch's periodogram (FFT) technique.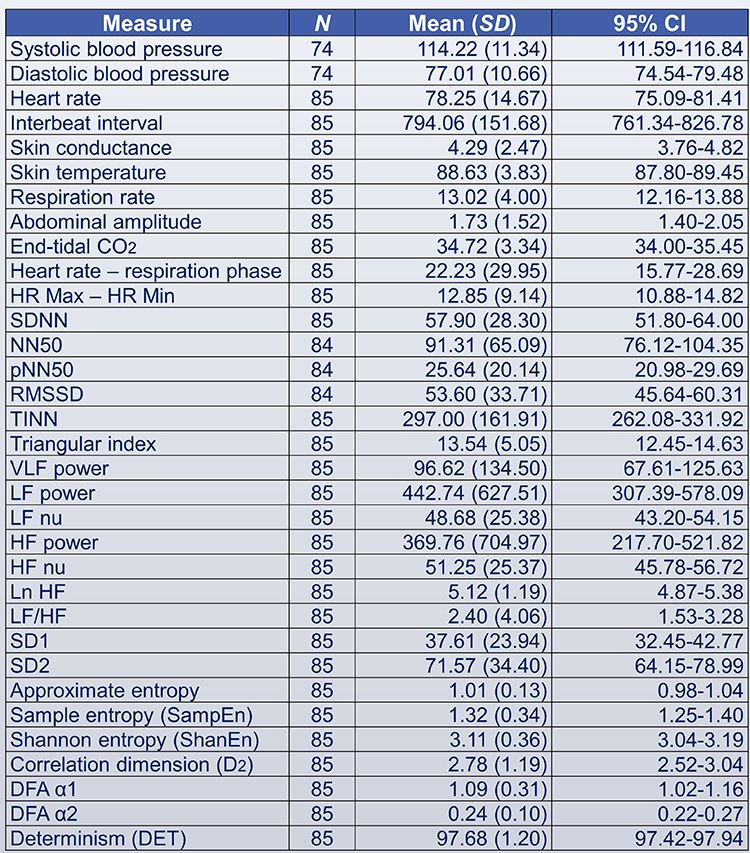
Elite Athletes
Optimal performance professionals should be interested in the Berkoff et al. (2007) short-term norms from 145 elite track-and-field athletes measured before the 2004 U.S.A. Olympic Trials. The investigators monitored the athletes in the supine position using ECG after up to 5 minutes of rest to stabilize HR.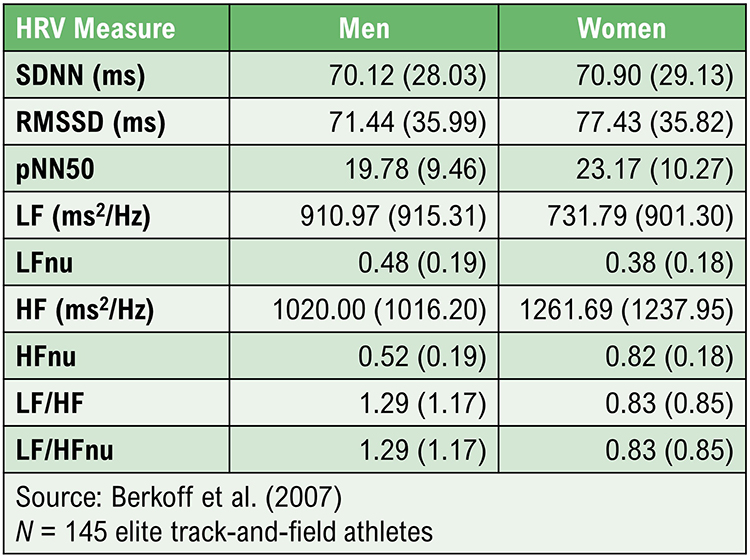
24-Hour Measurement Norms
Umetani et al. (1998) published 24-hour norms for 260 healthy participants aged 10-99 years old. They reported that several HRV time-domain indices declined with age. After age 65, subjects fell below cutoffs for increased threat of mortality. Before age 30, female subjects had lower HRV measurements than their male counterparts. This gender difference vanished after 50 years of age.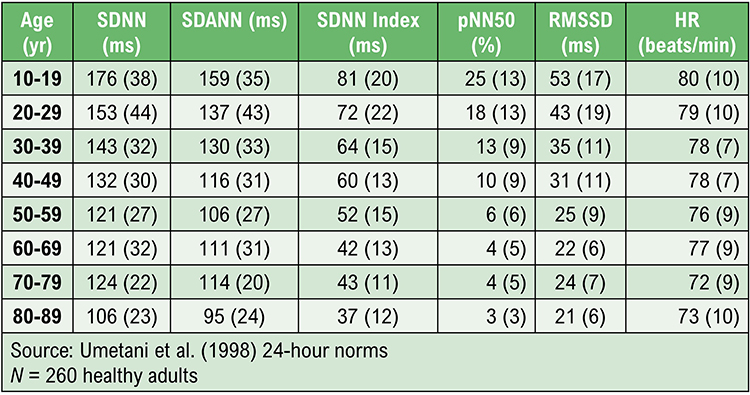
The Task Force report (1996) reported 24-hour norms for 144 healthy subjects and included cutoffs for increased mortality risk.
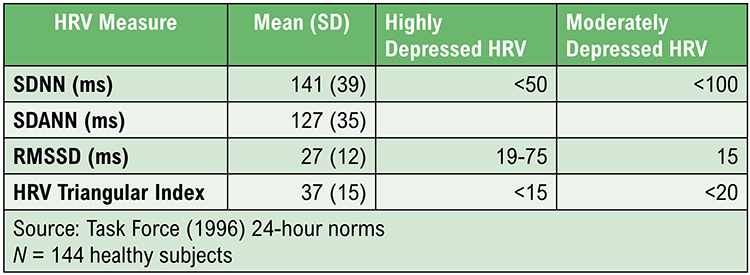
Institute of HeartMath Autonomic Assessment Reports
The Institute of HeartMath's Autonomic Assessment Reports evaluate 24-hour recordings using age-related norms. They compare a client's time-domain and normalized frequency-domain measurements to age-related reference values.In the frequency-domain analysis summary below of a 51-year-old male with elevated heart attack risk, all indices fell significantly below the natural log values for his age. See the diminished 24-hour SDNN index time-domain plot. The graphics below are © Institute of HeartMath.
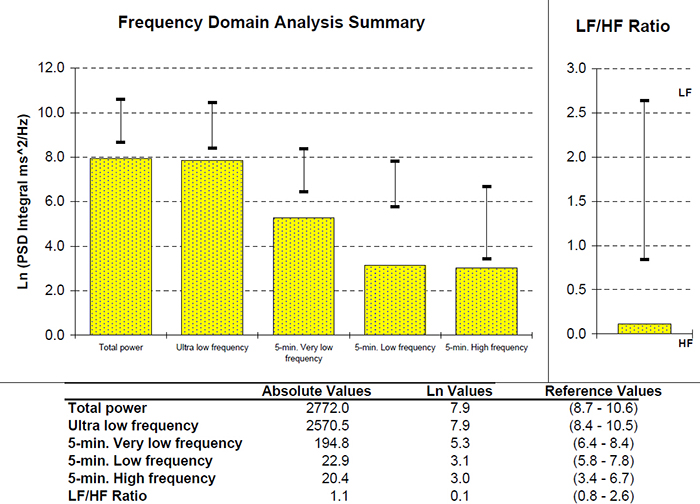
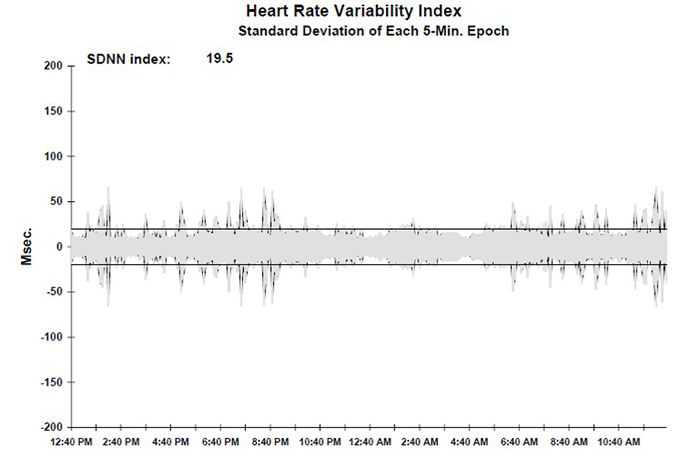
Low VLF power is an important finding since it is associated with an elevated heart attack risk (Bernardi, Valle, Calciati, & Sleight, 1996).
Compare the previous record with the 24-hour frequency domain summary and SDNN index plot for a 25-year-old aerobically-fit client. The younger, healthier client exhibited greater total power and power in each of the four bands. The SDNN index value of 104.1 eclipsed the older client's 19.5. Graphics © the Institute of HeartMath.
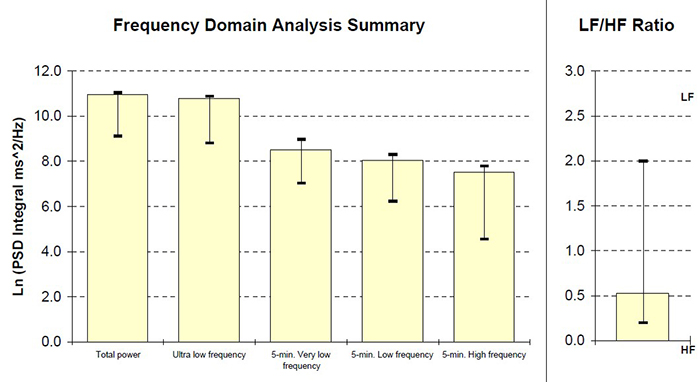
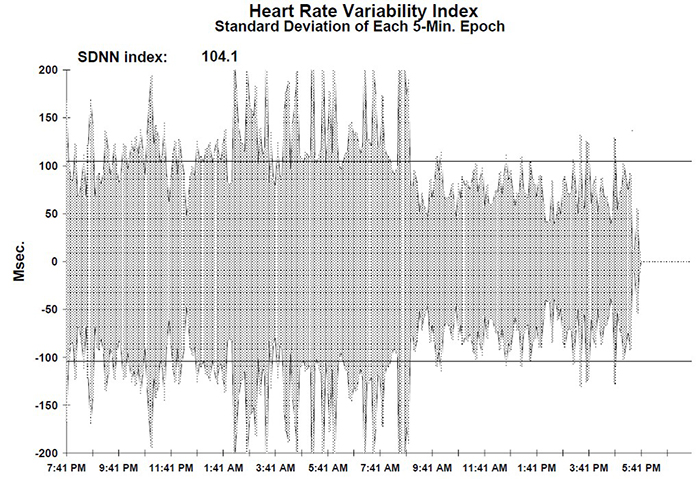
HRV Values During Baselines and HRV Biofeedback
Baseline Values
Baselines can be 3-5 minutes of resting activity without PB or feedback. Since baseline length can affect HRV values, use identical epochs for pre-session and post-session measurements. Most signal power should fall in the HF band (green) instead of the LF band (salmon) since your client is breathing at typical rates.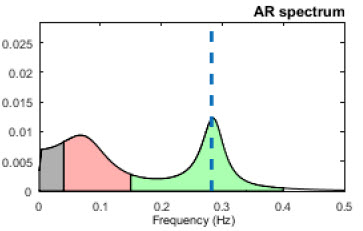
Distract clients (e.g., reading or video) during post-baselines to prevent their continuation of PB (Gevirtz, 2020).
HRV measurements will be invalid if clients don’t breathe at normal rates.
Comparing Pre-Session to Post-Session Baseline Values
You can compare pre-baseline to post-baseline values within a session to evaluate progress. Look for increases in time domain measures (HR Max-HR Min and RMSSD), HF power, and total power (VLF+LF+HF). You will only see greater LF power if breathing has slowed below 8 bpm.Look for these same changes when you compare pre-baselines across sessions. These changes may reflect learning due to training in the clinic and practice.
HRV Biofeedback Training Measurements
During HRV training, increased VLF can serve as a “red flag” like increased skin conductance level and decreased finger temperature. Greater VLF power may signal anxiety, effort, or vagal withdrawal. A mindfulness approach that encourages passive volition can reduce VLF power due to these causes.RSA
RSA should increase when your clients breathe near their resonance frequency (Vaschillo et al., 2002). Graphic © Elite Academy.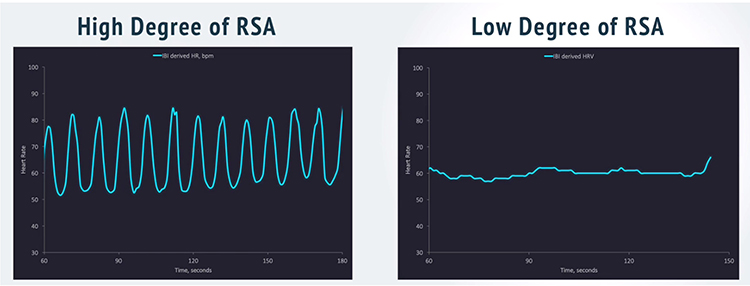
Increased RSA immediately “exercises” the baroreflex without changing vagal tone or tightening BP regulation. Those changes require weeks of practice. HRV biofeedback can increase RSA 4-10 times compared to a resting baseline (Lehrer et al., 2020b; Vaschillo et al., 2002).
Listen to a mini-lecture on Increased RSA © BioSource Software LLC. Graphic adapted from Gevirtz et al., 2016).